Samsung SDI: Why I’m Not Adding At ₩567,000, And Where I Would

Samsung SDI series: Part 1 · Part 2 · Part 3
🇰🇷 한국어 원문 · Originally written in Korean on Oct 13, 2026. Charts are in Korean; key figures are restated in the text.

Summary

  • I’m not adding to Samsung SDI at ₩567,000. I’d buy in tranches on a pullback to ₩530,000-550,000, and add on a confirmed breakout above ₩597,000 after 3Q26.
  • Broker targets range from ₩402,000 to ₩1,000,000. The spread is mostly about the multiple: “battery maker” vs. “power infrastructure.”
  • At a battery-cell EV/EBITDA multiple, fair value is ~₩590,000, roughly today’s price. The battery story looks priced in.
  • Technicals: a Bollinger Band squeeze inside an uptrend, but volume is fading and there’s overhead supply at ₩600,000-720,000. Risk/reward from here is about 1:0.5.
  • Probability-weighted 12-month value is ~₩650,000 (+15%), with 21% downside in the bear case.

This is my final piece on Samsung SDI.

Part 1 covered the quality of earnings, and Part 2 the turnaround stage and growth. This time it’s about price.

Bottom line first: I’ve decided not to add new shares at the current price (₩567,000, the Oct 9 close when I ran the analysis). If we get a pullback, I’ll buy in tranches between ₩530,000 and ₩550,000.

And if the stock closes above ₩597,000 after 3Q26 results, I’ll add more. Here’s why.

1. Price Targets Range From ₩400,000 To ₩1,000,000
Broker price targets for Samsung SDI (FnGuide)

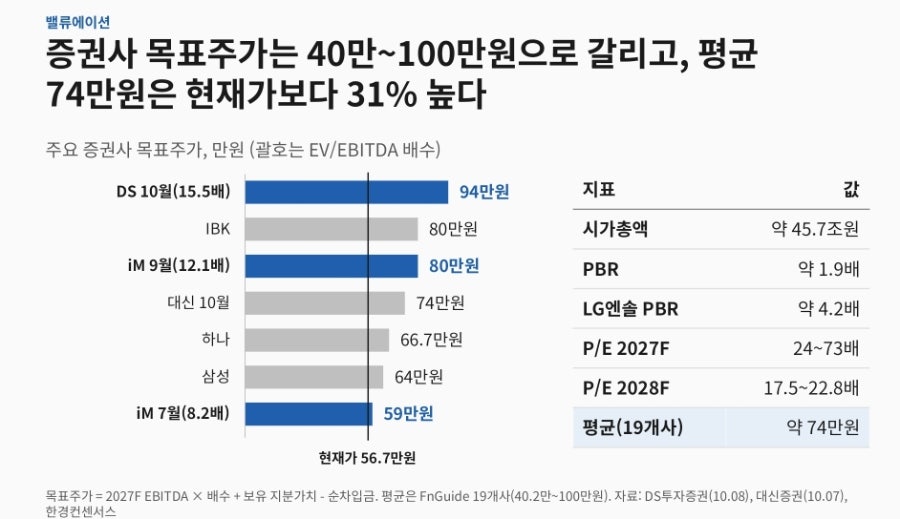
According to FnGuide, price targets from 19 brokers range from ₩402,000 to ₩1,000,000. The average is ₩741,000, 31% above the current ₩567,000 (741 / 567 = 1.31).

What’s interesting is how much the answer changes with the same earnings forecast just by swapping the multiple:

  • Battery cell peer multiple (8.2x EV/EBITDA) → ₩590,000 (iM Securities, July)
  • Power equipment peer multiple (12.1x) → ₩800,000 (iM Securities, September)
  • Custom multiple (15.5x) → ₩940,000 (DS Investment, October)

In the end, it comes down to whether the market sees SDI as a “battery company” or a “power infrastructure company.”

It’s the same idea as the growth debate in Part 2: whether you focus on the high growth rate or on the decelerating delta is a matter of perspective. At the battery-cell multiple, ₩590,000 is roughly today’s price (590 / 567 = +4%). Doesn’t that suggest the value as a battery company is already in the price?

For reference, versus LG Energy Solution, SDI has the better balance sheet and lower P/B, but smaller US ESS capacity:

  • Debt/equity: SDI 77% vs. LGES 157%
  • P/B: SDI 1.9x vs. LGES 4.2x
  • US ESS capacity: SDI 30GWh vs. LGES 50GWh+

One more balance sheet point. Free cash flow has been negative for ten straight quarters, about ₩9.9tn cumulative, and net debt stood at ₩10.6tn in 2Q26. However, SDI still holds a 10.22% stake in Samsung Display, worth roughly ₩9.1tn at the recent transaction price. Having a card to play without a rights offering is an advantage over peers; SK On has gone back to equity investors repeatedly. On the flip side, equity-method income drops by about 33%, so from 2027 the core business has to carry more of the load.

2. Technicals: A Squeeze Inside An Uptrend
Daily chart with Bollinger Bands, trendlines and volume profile (Oct 2025 - Oct 2026)
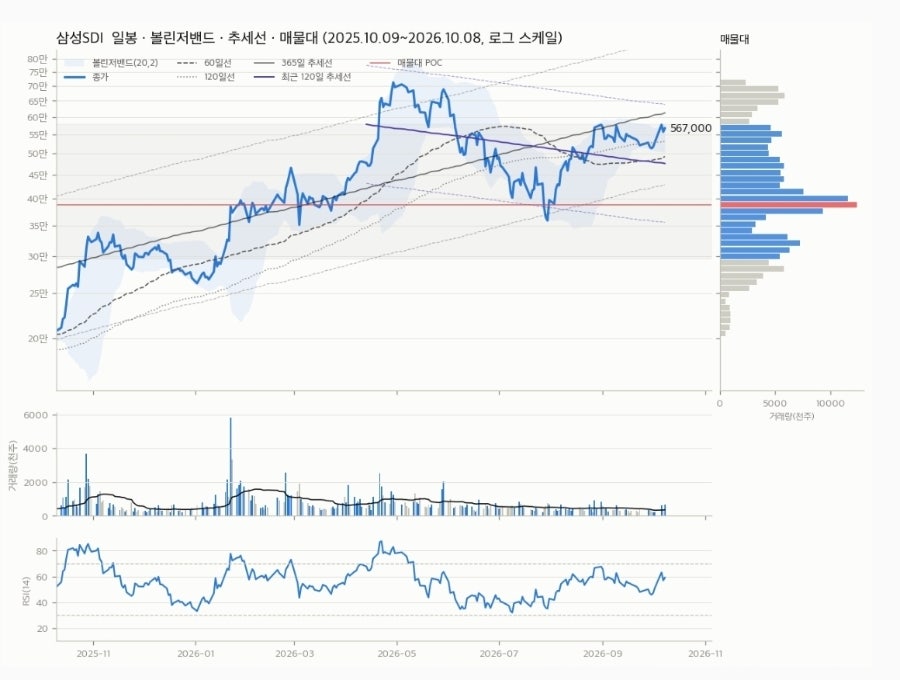
Daily chart with Bollinger Bands, trendlines and volume profile (Oct 2025 – Oct 2026)

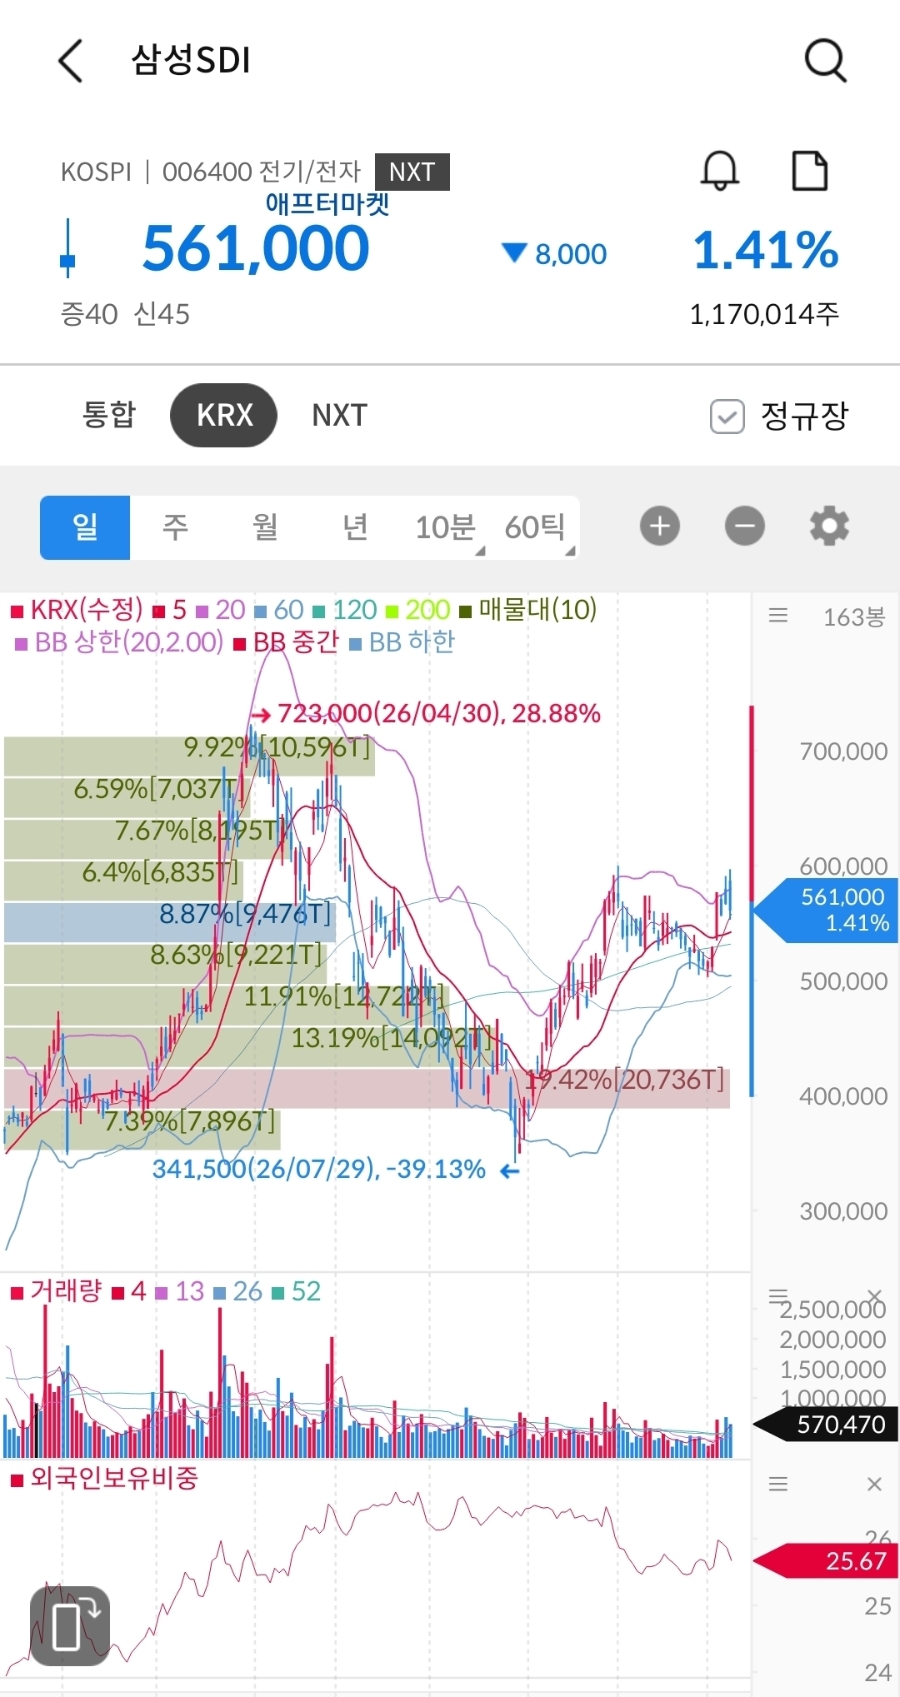
Over the past year the stock has gone from ₩207,000 to ₩567,000, up 174% (567 / 207 = 2.74x). The 365-day trendline is still rising at about +120% annualized.

What stands out is the Bollinger Band width: 14.1%, in the bottom 10% of the past year. Squeezes like this often resolve with a big move in one direction. Up or down.

A couple of things bother me. Volume is shrinking as the price rises: 20-day average volume is 0.83x the 60-day average. On-balance volume (OBV) is also diverging from price.
Volume profile: support and resistance zones

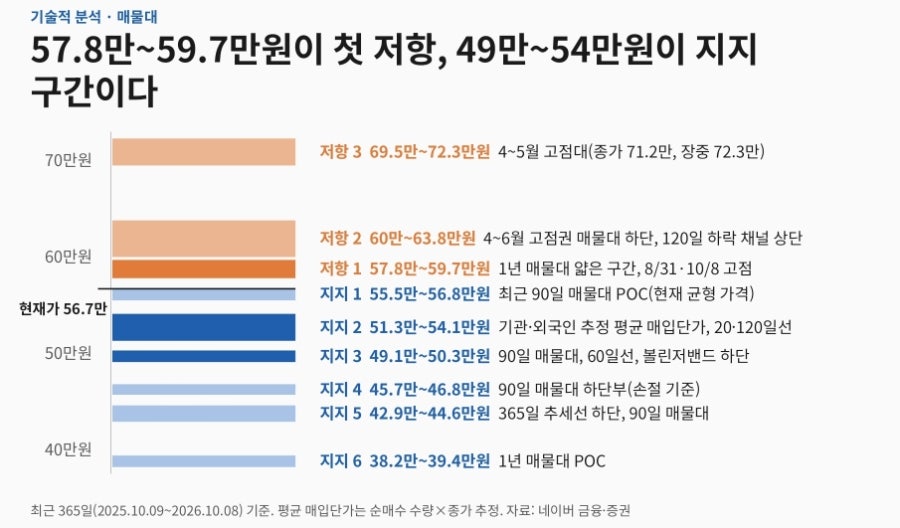
The stock sits just above Support 1 (₩555,000-568,000) and just below Resistance 1 (₩578,000-597,000). The ₩578,000-597,000 zone is a thin, low-volume area over the past year.

Both the Aug 31 high and the Oct 8 intraday high (₩591,000) were rejected here. A break through could run quickly into the low ₩600,000s.

Above that, though, ₩600,000-720,000 is full of trapped supply from the April-June highs. Here’s the math on buying now at ₩567,000:

  • Downside to my stop at ₩457,000: -19%
  • Upside to first target at ₩600,000-638,000: +6-13%
  • Risk/reward: about 1:0.5

For a cautious investor like me, that’s not a spot where I can pull the trigger.

3. Flows: Institutions Are Driving This Stock
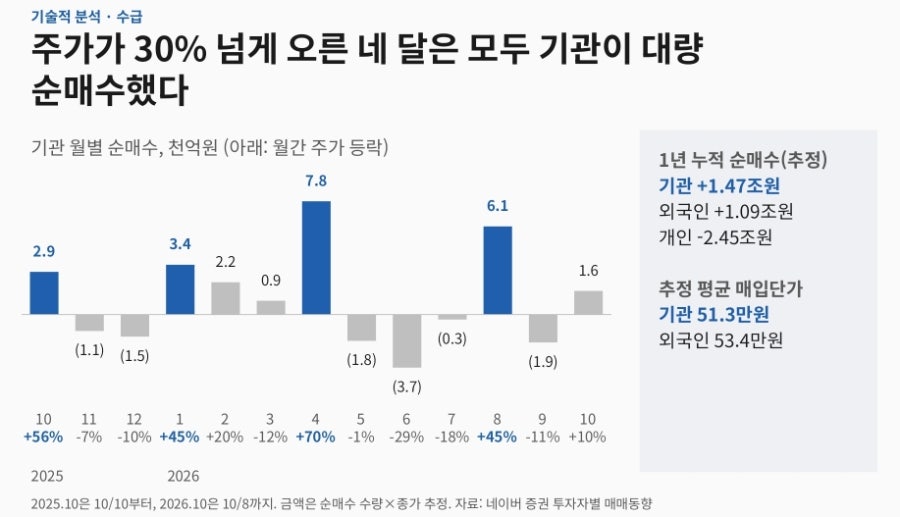
Monthly net buying by investor type vs. share price

Every month in which the stock gained more than 30% was a month of heavy institutional net buying. In June, when it fell 29%, institutions sold ₩366.1bn. Cumulative 12-month net buying:

  • Institutions: +₩1.47tn
  • Foreigners: +₩1.09tn
  • Retail: -₩2.45tn

Retail got off the train early. Again.

Estimated average cost is ₩513,000 for institutions and ₩534,000 for foreigners. The current price is 10.5% above the institutional cost basis and 6.2% above the foreign one (567/513, 567/534).

If the stock pulls back to ₩510,000-530,000, it’s near their breakeven, where defensive buying is likely to show up. That’s why I set my first buy zone at ₩530,000-550,000.

4. Scenarios And Trading Plan
12-month scenarios
12-month scenarios

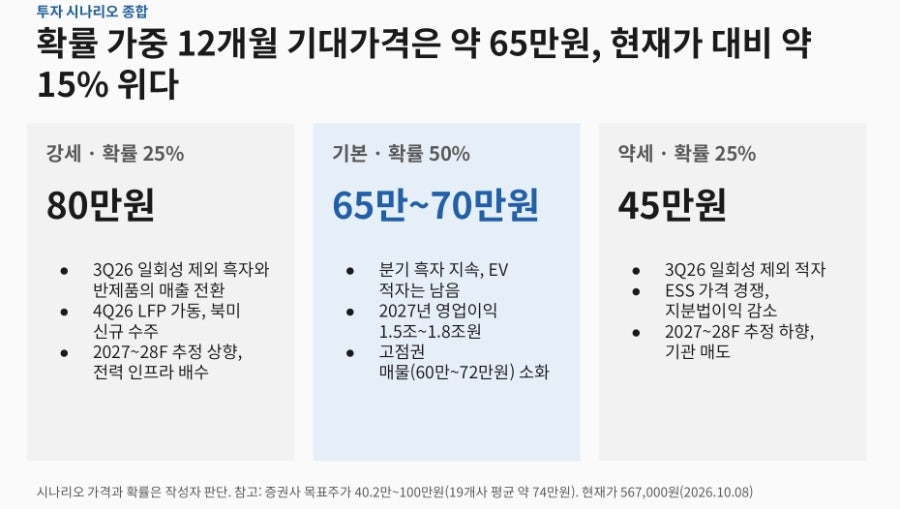
12-month scenarios (my own judgment):

  • Bull, 25%: ₩800,000 (+41%). 3Q26 profitable ex-one-offs, WIP converts to revenue, 2027-28E estimates move up.
  • Base, 50%: ₩650,000-700,000 (+15-23%). Quarterly profits continue, EV losses persist, overhead supply gets absorbed.
  • Bear, 25%: ₩450,000 (-21%). 3Q26 loss-making ex-one-offs, ESS price competition, estimate cuts.

The probability-weighted value is ₩650,000 (0.25×80 + 0.5×67.5 + 0.25×45, in ₩10,000s, using the base-case midpoint). That’s +15% from here.

There’s upside, but the bear-case drawdown (-21%) is significant. Better to build in tranches as conditions are confirmed than to go all in at once.
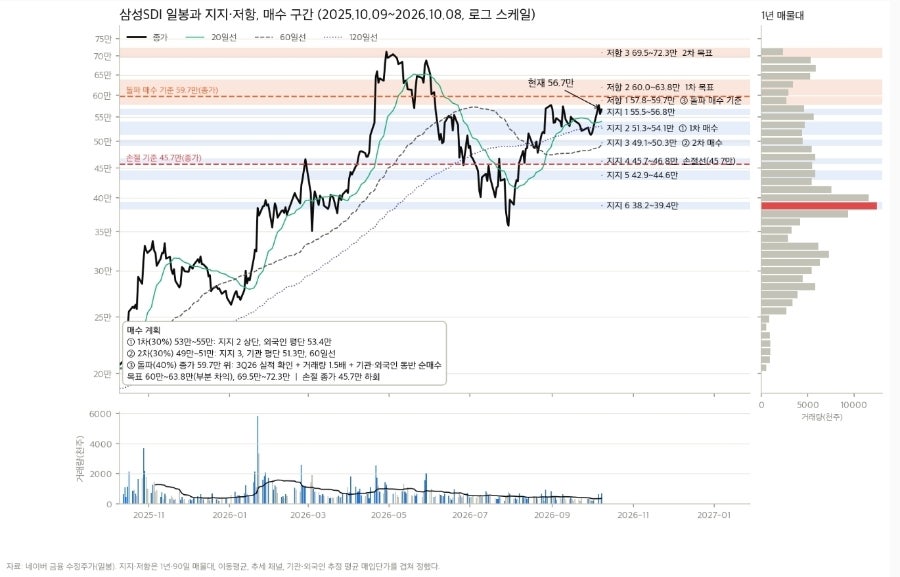
Trading plan summary

Trading plan

  • At ₩567,000 now: no new buys; existing holders hold
  • Pullback tranche 1, ₩530,000-550,000: 30%
  • Pullback tranche 2, ₩490,000-510,000: 30%
  • Breakout add: 40%
  • Stop: close below ₩457,000 (₩555,000 for the breakout tranche)

The breakout add requires all three of the following:

  1. A close above ₩597,000 after 3Q26 results
  2. Volume at 1.5x normal
  3. Institutions and foreigners net buying together

If it breaks out without a pullback first, I start with just the 40%. And if neither happens? I wait.

What I’m Watching

  1. Late-October 3Q26 results: profit ex-compensation and AMPC, 30%+ ESS revenue growth, lower WIP inventory, changes to 2027E consensus
  2. Flows: joint institutional/foreign buying on a break above ₩597,000; whether foreign ownership breaks above 26.7%
  3. November: Bank of Korea rate decision; any changes to US 45X and 48E rules
  4. 4Q26: Indiana LFP mass production and rising AMPC, the New Carlisle ESS conversion, new North American orders

When 3Q26 results are out, I’ll come back and review them against this piece.

Disclosure: I have a long position in Samsung SDI (006400.KS). This is a personal investment journal, not investment advice. Scenario probabilities and price levels are my own judgment. Do your own due diligence.
Samsung SDI’s Turnaround: Is It Following SK Hynix’s Playbook?

Samsung SDI series: Part 1 · Part 2 · Part 3
🇰🇷 한국어 원문 · Originally written in Korean on Oct 13, 2026. Charts are in Korean; key figures are restated in the text.

Summary

  • Samsung SDI is following the same sequence as SK Hynix in 2022-2024: share price bottom, peak losses, then a return to profit.
  • The difference: SDI’s stock rose 182% by the breakeven quarter vs. 89% for SK Hynix. Twice the move, with a 2027E operating margin of only 8-9%, mostly AMPC.
  • The “next stage” signals haven’t shown up yet. Work-in-process inventory doubled YoY and customer advances fell 44%.
  • Growth is the bull case: 2027E operating profit growth of +235% is over 4x that of Korean semi equipment leaders. But the delta (acceleration) turns sharply negative in 2028E.
  • I’ll add only on meaningful dips until 3Q26 results confirm four specific checkpoints.

At the end of Part 1, I said I’d compare Samsung SDI with SK Hynix to see how far along SDI is in its turnaround.

The question I’m trying to answer: after a ~170% run this year, does SDI’s stock still have room to go?

I benchmarked it against SK Hynix’s 2022-2024 turnaround. Like SK Hynix back then, SDI is in the early innings of a recovery, following the same sequence: share price bottom, then peak losses, then a return to profit.

My concern is that the stock has run ahead of earnings, and by a lot.

That said, investing is relative, not absolute. On growth, SDI looks more attractive right now than the other market-leading sectors, and I’ll concede that point. It’s why I raised my weighting in Korean battery names last month.

Still, I think the right move is to wait for 3Q26 results in late October, check a few things, and only then size up. Before that, I’ll only buy in tranches if the price comes down enough.

Four things I want to see:

  1. Has work-in-process (WIP) inventory come down?
  2. Has ESS revenue grown by 30%+?
  3. Is the business profitable ex-compensation and ex-AMPC?
  4. Are 2027E+ earnings estimates moving up alongside?

If all four check out, earnings will have caught up with the share price.

Three reasons I’m staying conservative:

  1. At the same turnaround stage, SDI’s stock has risen twice as much as SK Hynix’s did.
  2. “Next stage” signals (inventory drawdown, rising customer advances) haven’t appeared yet.
  3. Growth is outstanding, but upgrades are concentrated in this year and the durability (delta) is lacking.

Let’s go one by one.

1. Same Turnaround Stage, Twice The Share Price Move

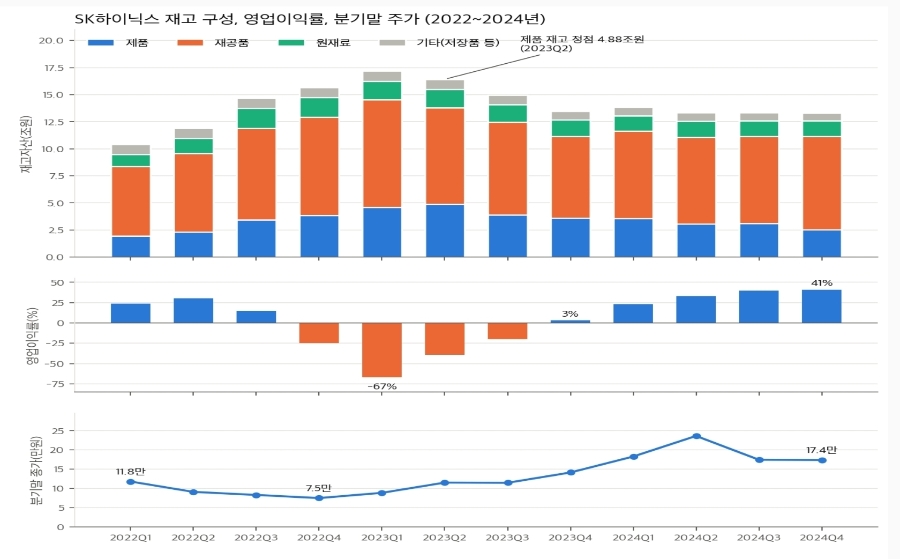
SK Hynix: share price vs. operating profit, 2022-2024

SK Hynix’s share price bottomed one quarter before peak losses and four quarters before returning to profit.

SK Hynix: share price bottom Dec 2022 → peak loss 1Q23 → back to profit 4Q23

Now Samsung SDI:

Samsung SDI: share price vs. operating profit

Samsung SDI: share price bottom 2Q25 → peak loss 3Q25 → back to profit 2Q26

Same sequence. But the share price gain up to the breakeven quarter is very different:

  • SK Hynix: +89%
  • Samsung SDI: +182%

At the same stage, SDI has run about twice as far (182 / 89 = 2.04x).

The earnings power to back it up is different too. SK Hynix went on to operating margins of 40%, which supported the stock. SDI’s 2027E operating margin is 8-9%, and most of that is AMPC (the US advanced manufacturing production credit). It feels like the market has already gotten well ahead of itself.

2. No “Next Stage” Signal Yet

At SK Hynix, inventory flagged the recovery first. Finished goods inventory fell 48% from its 2Q23 peak. SDI is going the other way.

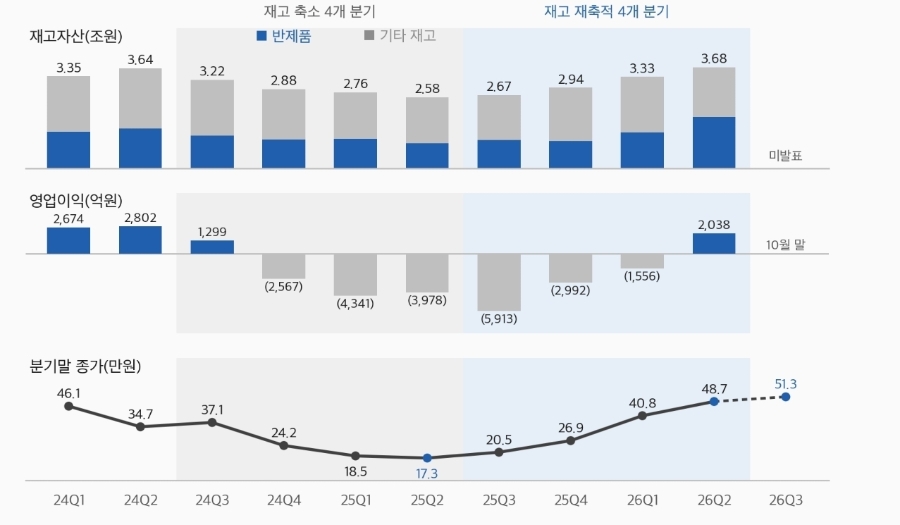
Samsung SDI inventory, 2Q25 → 2Q26:

  • Total inventory: ₩2.58tn → ₩3.68tn (+43%)
  • Work-in-process: ₩0.92tn → ₩1.86tn (+102%)
  • Customer advances: ₩1.09tn → ₩0.61tn (-44%)

Inventory has built up while advances have fallen.

2Q26 inventory of ₩3.68tn matches the 2Q24 peak. Days of inventory are at 118, the longest in the last ten quarters. Small-cell utilization has risen from 57% to 81%, so demand is clearly back. But it isn’t showing up in customer advances yet.

The finished-goods drawdown that marked SK Hynix’s turn hasn’t been confirmed at SDI. To be fair, the WIP could simply be product waiting to ship. According to IBK Securities, some domestic grid ESS revenue slipped from 2Q26 into 3Q26. If WIP falls and ESS revenue grows 30%+ in 3Q26, that reading will be vindicated.

3. Growth Is Outstanding, Durability Less So

On points 1 and 2 alone, SDI looks weaker than SK Hynix’s powerful 2022 turnaround. But again, investing isn’t graded on an absolute scale. What matters is how attractive it is relative to other opportunities at the same moment.

What the market is looking at in SDI and Korean batteries right now is growth over this year and next. So I checked the growth numbers.

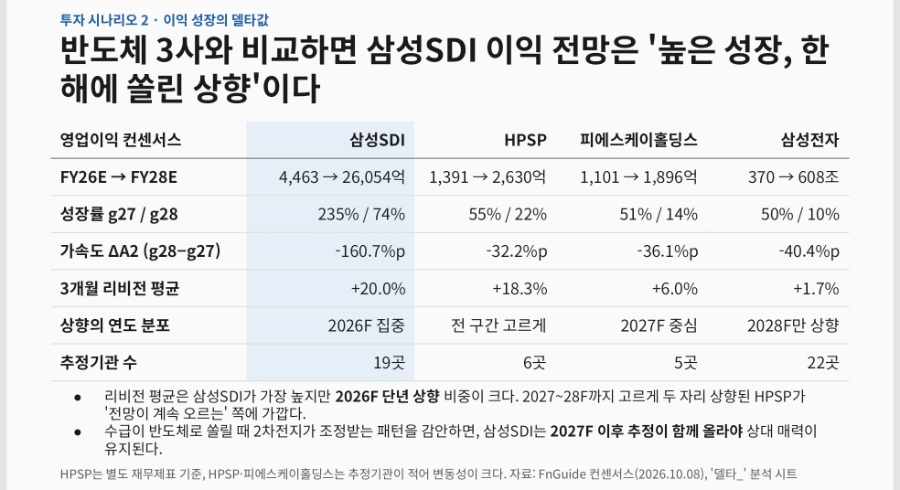
My comparison group is the other leading theme in Korea: semiconductor equipment and materials, represented by HPSP and PSK Holdings. Figures are YoY growth in FnGuide operating profit consensus (as of Oct 8, 2026). First, the good news:

Operating profit growth: Samsung SDI vs. HPSP vs. PSK Holdings

2027E operating profit growth

  • Samsung SDI: +235%
  • HPSP: +54.6%
  • PSK Holdings: +50.5%

SDI’s 2027E growth is more than 4x the equipment names (235 / 54.6 = 4.3x; 235 / 50.5 = 4.7x).

2028E operating profit growth

  • Samsung SDI: +74.3%
  • HPSP: +22.3%
  • PSK Holdings: +14.4%

Still more than 3x in 2028E (74.3 / 22.3 = 3.3x; 74.3 / 14.4 = 5.2x).

That’s probably why the market is so focused on SDI’s growth. The problem is durability.

First, the estimate upgrades are concentrated in this year.

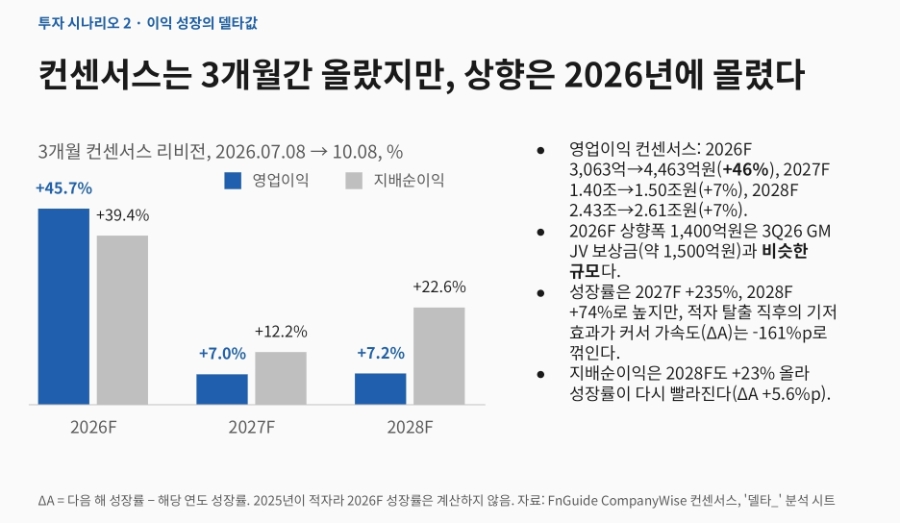
Operating profit consensus revisions, last 3 months

Operating profit consensus, 3-month change

  • 2026E: ₩306.3bn → ₩446.3bn (+46%)
  • 2027E: ₩1.398tn → ₩1.495tn (+7.0%)
  • 2028E: ₩2.430tn → ₩2.605tn (+7.2%)

The 2026E upgrade is ₩140bn, almost exactly the size of the ~₩150bn GM JV compensation expected in 3Q26. To me, this looks less like a higher long-term earnings outlook and more like a one-off being baked into this year.

Second, growth is decelerating. I call the change in growth rate versus the prior year the “delta.” Going fast and accelerating are two different things.

Delta (2028E growth minus 2027E growth)

  • Samsung SDI: -160.7pp
  • HPSP: -32.2pp
  • PSK Holdings: -36.1pp

SDI’s deceleration is 4-5x that of the equipment names (160.7 / 36.1 = 4.5x; 160.7 / 32.2 = 5.0x).

+235% in 2027E is still huge growth. But by 2028E, the delta turns sharply negative.

In my experience, the market tends to get excited when the delta is expanding. Current consensus doesn’t see that happening.

Base effects matter, of course. Growth off a 2025 loss is bound to be high, and the slowdown is bound to look steep. In absolute terms, the increments are similar:

  • 2027E increase: +₩1.049tn (14,950 – 4,463, in ₩100m)
  • 2028E increase: +₩1.110tn (26,054 – 14,950)

So growth is both a strength and a weakness. The level is far above the equipment names; the durability is underwhelming. Which one you weight more heavily is the crux of the debate.

My view is that for the market to get excited again, the delta needs to improve, which means 2027E+ estimates need to move higher.

In the late-October 3Q26 results, I’ll be checking the four criteria above:

  1. Has WIP inventory come down?
  2. Has ESS revenue grown by 30%+?
  3. Is the business profitable ex-compensation and ex-AMPC?
  4. Are 2027E+ earnings estimates moving up alongside?

If they’re confirmed, I think adding to the position is the right call.

If the growth is attractive, the remaining question is price. How much should you pay for this growth?

In the final part, I lay out valuation and my trading plan.

Disclosure: I have a long position in Samsung SDI (006400.KS). This is a personal investment journal, not investment advice. Scenario probabilities and price levels are my own judgment. Do your own due diligence.
Samsung SDI Is Back In The Black, But Check The Quality Of Earnings

Samsung SDI series: Part 1 · Part 2 · Part 3
🇰🇷 한국어 원문 · Originally written in Korean on Oct 13, 2026. Charts are in Korean; key figures are restated in the text.

Summary

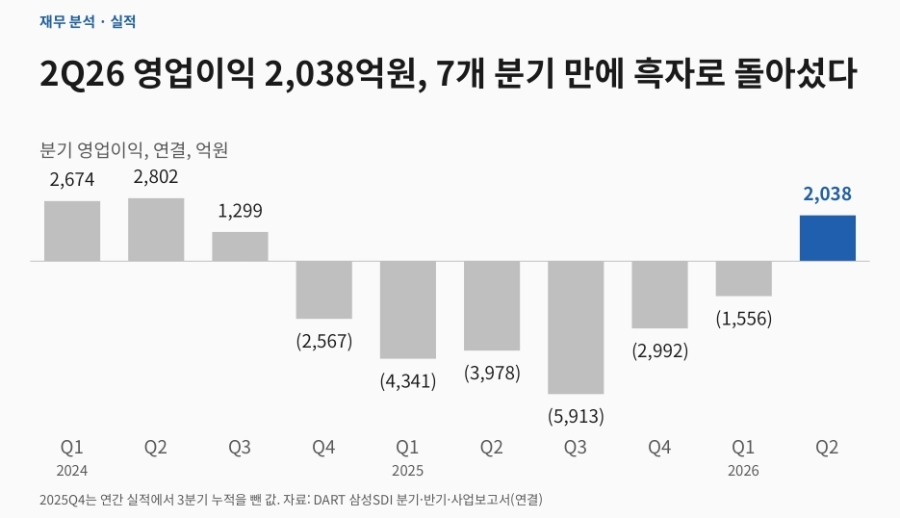
  • Samsung SDI swung back to an operating profit of ₩203.8bn in 2Q26, its first in seven quarters. The stock is up 174% over the past year.
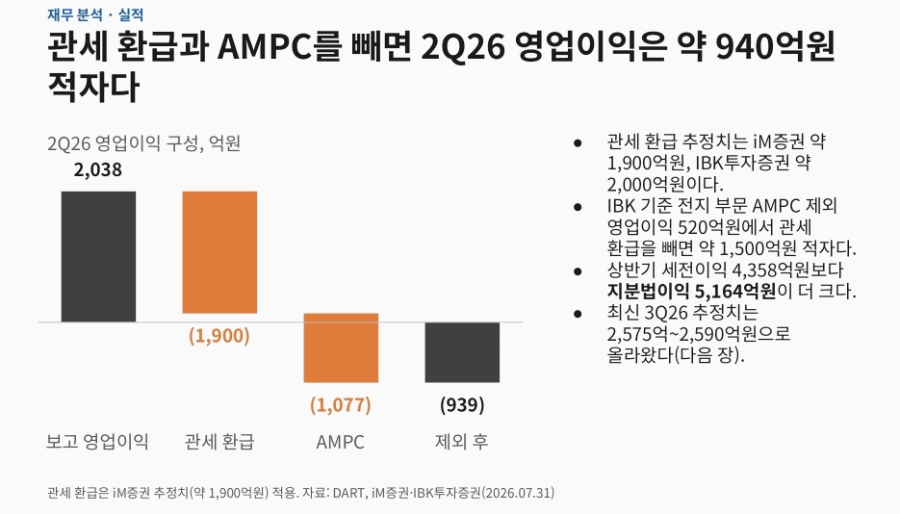
  • Strip out a ~₩190bn tariff refund and ₩107.7bn of AMPC (US 45X production credits), and the core business still lost roughly ₩94bn.
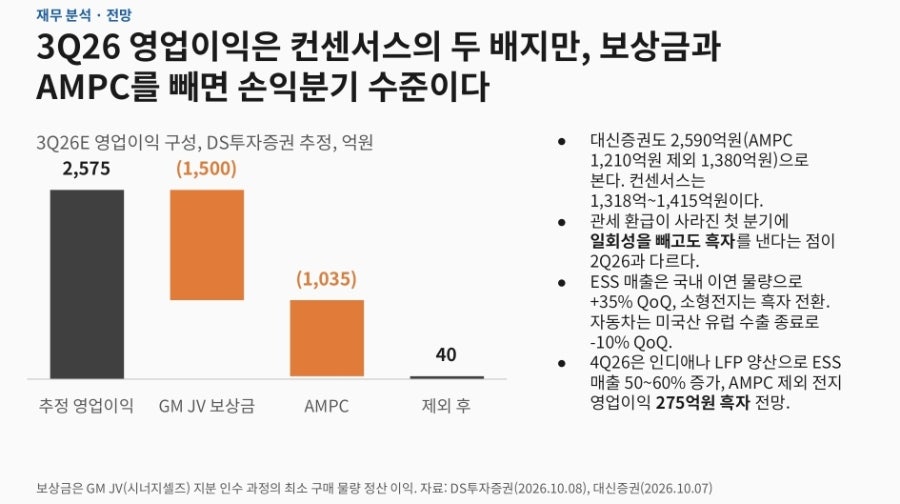
  • Sell-side 3Q26 estimates (~₩258bn) are about double consensus, but ex-GM JV compensation and AMPC, the quarter is roughly breakeven.
  • The industry backdrop (EV to ESS, China out of the US supply chain) clearly favors SDI. The catch: 2027 earnings lean heavily on US tax credits.
  • Part 1 of 3. Part 2 looks at where SDI sits in its turnaround; Part 3 covers valuation and my trading plan.

Samsung SDI (006400.KS) posted ₩203.8bn of operating profit in 2Q26, returning to the black after seven straight quarters of losses. The stock has gained 174% over the past twelve months.

Samsung SDI share price, past 12 months

Energy storage (ESS) has been a sector I follow closely even without a position.

Back in August 2025, when I wrote about the opportunity for Korean battery makers in the US BESS market, I concluded that SDI was the one to watch over LG Energy Solution. My reasoning: the prohibited foreign entity (PFE) rules in the One Big Beautiful Bill Act (OBBBA) made the exit of Chinese cells from the US market a matter of time, and with a market cap of just ₩15.5tn at the time, SDI was the name where ESS could actually move the needle on group earnings.

The problem was the risk/reward. I saw 36% downside against less than 1:1 upside, so I shelved it as “an idea to revisit as SDI’s order book builds.”

In January 2026, when ERCOT, PJM and SPP started floating curtailment measures for data center power supply, I argued that BESS would become a must-have for data centers. In July, looking at Australia’s grid, I wrote that there is no easier fix for grid stress than storage. Yet through all of that, I held zero exposure to batteries or ESS.

My earlier notes on ESS (in Korean):

The numbers have moved a lot since then. SDI’s market cap has gone from ₩15.5tn to ₩45.7tn (₩567,000 close on October 8).

And the recent price action across Korean battery names is hard to ignore. It’s flows and narrative moving first, not fundamentals. Stocks that used to be lumped together as “battery companies” are being re-rated as AI power infrastructure plays. This didn’t feel like a “keep watching” moment anymore, so I started a position.

Then I took SDI apart from scratch: DART filings, broker reports, flow data. The write-up got long, so I split it into three parts:

  1. Part 1: industry and earnings, i.e. the quality of earnings
  2. Part 2: turnaround stage and the delta in earnings revisions
  3. Part 3: valuation, technicals and my trading plan

As always, this is a record I fully expect to be wrong about in places.

1. Industry: The Growth Engine Is Shifting From EV To ESS

Global ESS vs. EV battery demand outlook

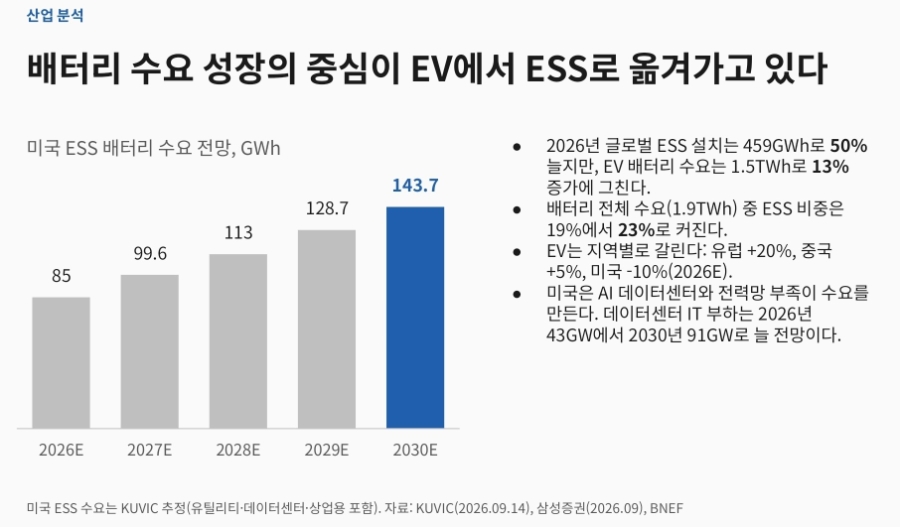
Global ESS installations are expected to grow 50% to 459GWh in 2026, while EV battery demand grows only 13% to 1.5TWh. ESS as a share of total battery demand rises from 19% to 23%.

EV demand is diverging by region: Europe +20%, China +5%, and the US -10%.

In the US, ESS demand is being driven by AI data centers and a shortage of grid capacity. Data center IT load is projected to climb from 43GW in 2026 to 91GW by 2030. With gas turbine lead times at around four years, storage is the fastest thing you can deploy, which is exactly what we saw play out in Australia.

US data center power demand and ESS
US ESS market and supply chain

The key is the US Section 48E investment tax credit. It requires the non-Chinese share of the supply chain to rise from 55% in 2026 to 75% by 2030. After credits, estimated installed cost is $241.5/kWh for Chinese cells vs. $135.1/kWh for Korean makers producing in the US.

Last year I said the PFE rules made a Chinese exit inevitable, and that call seems to be playing out. Some forecasts now have Chinese cells’ share of US ESS falling from 71.2% in 1H26 to just 3.9% by 2028.

SDI has signed two US ESS supply deals this year: roughly ₩3tn with Tesla (per press reports) and about ₩1.5tn with a US energy company. Both will be supplied from the StarPlus Energy plant in Indiana.

EV is the weak spot. SDI’s largest customer, BMW, has shifted its new platform toward CATL, and SDI’s EV volumes have now declined for three years running.

2. Earnings: Back In The Black, But…

Quarterly operating profit and gross margin

Operating profit bottomed at -₩591.3bn in 3Q25 and turned positive at ₩203.8bn in 2Q26. Gross margin recovered from 5.5% to 24.9%, above 2024 levels.

On the headline numbers, it’s a clean turnaround. Dig in, though, and the story changes.

2Q26 operating profit breakdown

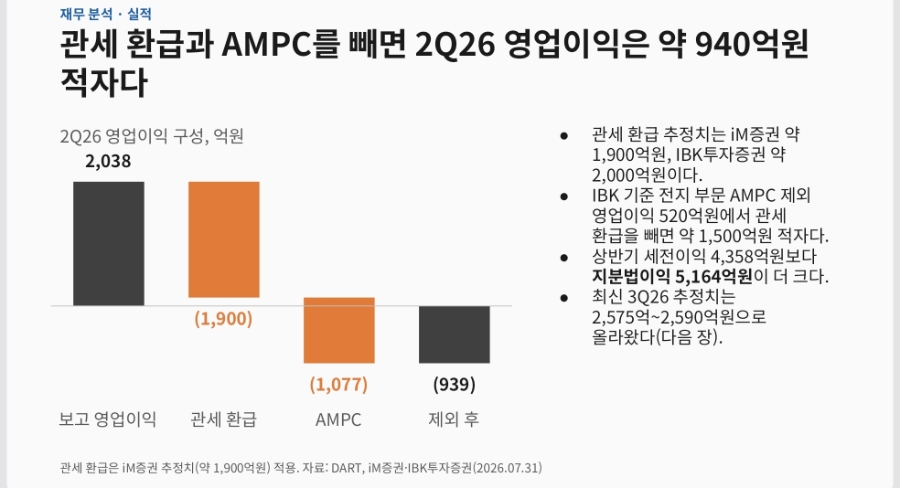
2Q26 operating profit of ₩203.8bn = ~₩190bn tariff refund + ₩107.7bn AMPC + ~-₩94bn everything else.

Excluding the tariff refund and AMPC, SDI is still loss-making. On top of that, 1H26 equity-method income (₩516.4bn) was larger than pre-tax income (₩435.8bn). In other words, most of the profit came from SDI’s stake in Samsung Display.

So what about 3Q26?

3Q26 operating profit estimates by broker

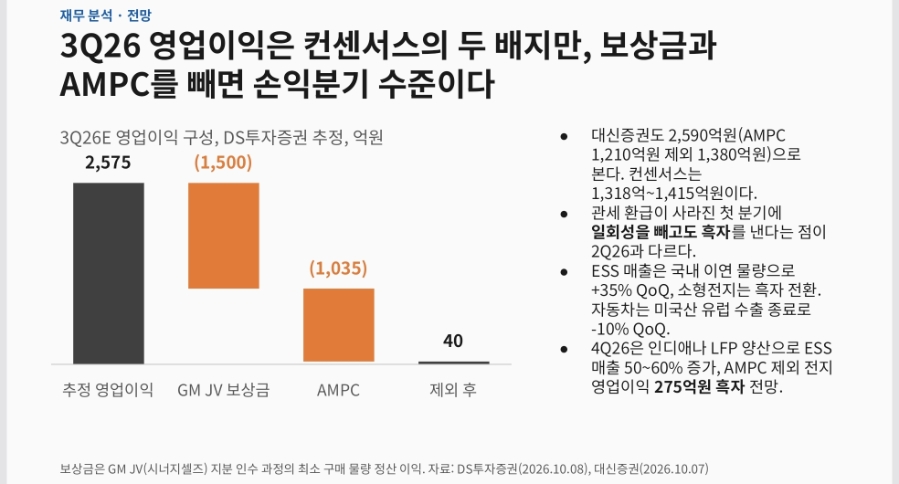
DS Investment & Securities expects ₩257.5bn of 3Q26 operating profit and Daishin Securities ₩259bn, roughly twice the consensus range of ₩131.8bn to ₩141.5bn.

But those numbers include about ₩150bn of compensation from the GM joint venture plus ₩103.5bn of AMPC. Back those out and you’re left with roughly ₩4bn. Essentially breakeven.

That’s not meaningless. 3Q26 is the first quarter without the tariff refund, and not being in the red even after excluding one-offs is a real improvement over 2Q26. ESS revenue is expected to rise 35% QoQ on delayed domestic shipments, and the small-cell business is expected to turn profitable. In 4Q26, ESS revenue could jump another 50-60% as the Indiana LFP line enters mass production.

3. Most Of 2027 Earnings Is AMPC

2027E operating profit and AMPC share

This is the part I struggle with most.

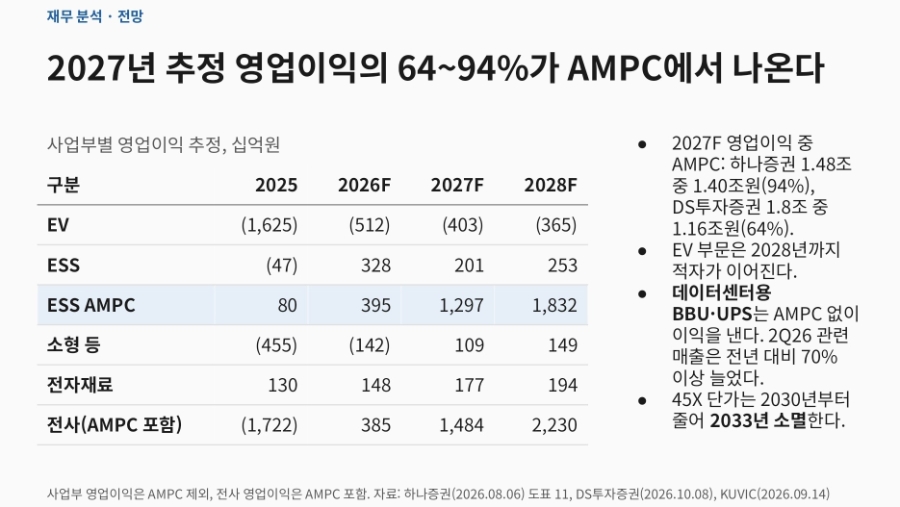
Hana Securities models 2027 operating profit of ₩1.48tn, of which ₩1.40tn (94%) is AMPC. DS Investment has ₩1.8tn with ₩1.16tn (64%) from AMPC. Estimates vary, but either way more than half of the profit is tax credits. The EV segment is expected to stay loss-making through 2028.

AMPC rates start stepping down in 2030 and phase out entirely by 2033. So if US policy shifts or the US lines ramp late, the 2027-2028 earnings outlook could be knocked over wholesale.

There’s an upside too. Data center BBUs (where SDI has roughly 50% cell share) and UPS are profitable without AMPC, and related revenue grew more than 70% YoY in 2Q26. Personally, I think we may eventually see a scenario where the market values SDI not as a “battery company” but as an “AI power infrastructure company.”

Part 1 Takeaways

  1. The industry direction (EV to ESS, decoupling from China) favors Samsung SDI.
  2. The swing to profit is real, but both 2Q26 and 3Q26 are at or below breakeven once you strip out one-offs and AMPC.
  3. 2027 earnings are also heavily AMPC-dependent. This is a structure that carries policy risk.

Ultimately, what matters in the late-October 3Q26 print is earnings ex-compensation and ex-AMPC.

In Part 2, I compare SDI with SK Hynix’s 2022-2024 cycle to figure out where SDI is in its turnaround.

Disclosure: I have a long position in Samsung SDI (006400.KS). This is a personal investment journal, not investment advice. Scenario probabilities and price levels are my own judgment. Do your own due diligence.
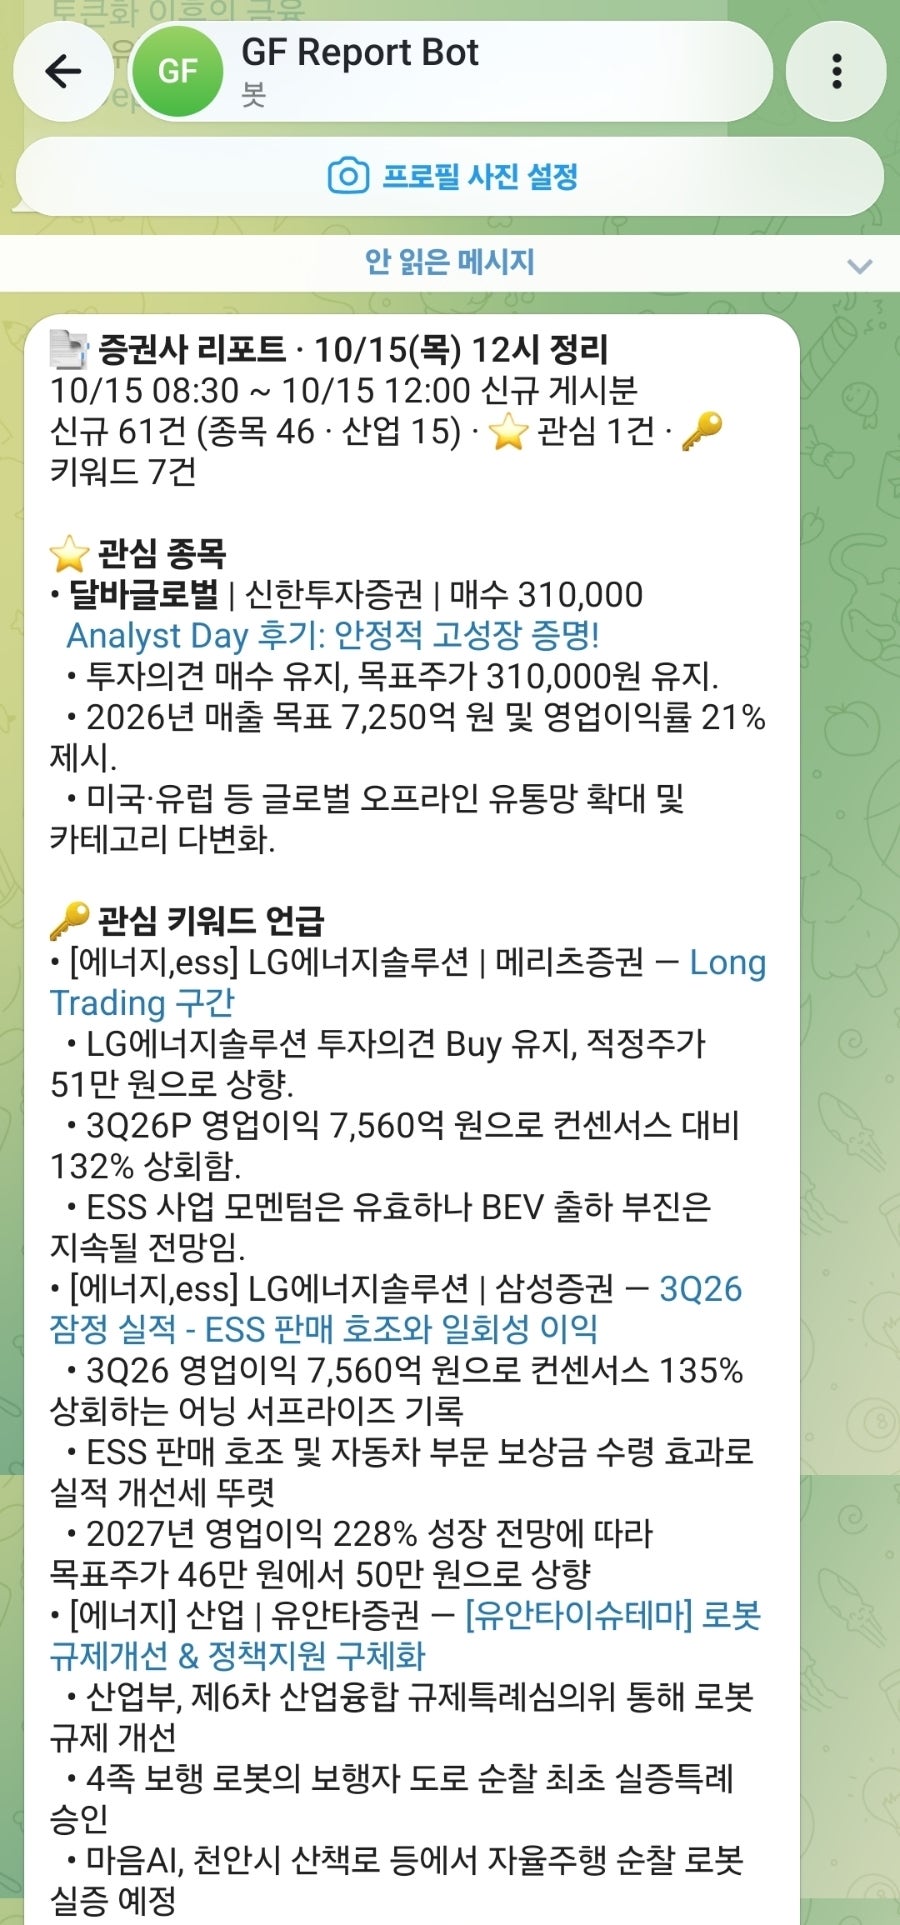
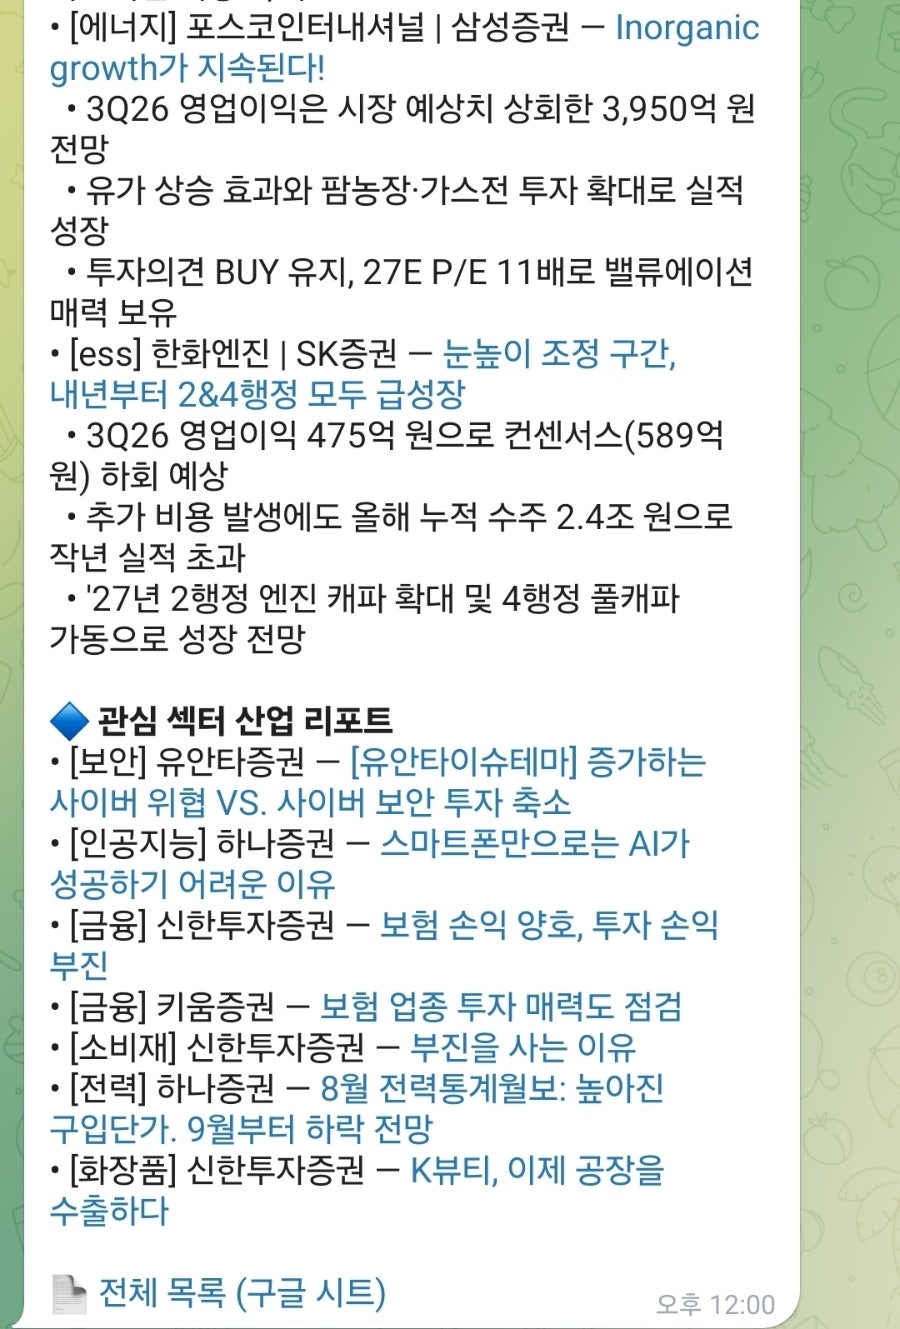
증권사 리포트 자동 취합 프로그램 프롬프트 공개

어제 클로드 코드로 만든 증권사 리포트 자동 취합 프로그램을 소개했습니다.
(클로드 코드로 리타민 구독 해지, 월 9만원 굳었다)

이 프로그램이 그간 구독하던 리타민의 기능을
당연히 100% 대체할 수는 없습니다.

지원 안 되는 증권사가 있고요.
리타민은 지금 사람들이 관심 갖고 읽는 리포트를 알려주는데, 이건 알 수 없습니다.
(어쩌면 구현할 수도 있을 것 같은데.. 굳이..)

그럼에도 굉장히 만족스럽습니다.

취합된 내용을 요약하여 텔레그램으로 하루 4번 보내주니,
제 수준에서는 리타민이 정말 필요 없어졌습니다.
9만 원 아꼈다고 생각하니 정말 만족스럽네요.

이 내용을 쓰레드에 공개했었는데,
나름 많은 분들이 관심을 가져주셨습니다.

관심에 대한 보답으로
이 프로그램을 직접 구축할 수 있는 프롬프트를
아래와 같이 공개합니다.

👉 프롬프트 보기 (GitHub Gist)

사용 방법

맥미니뿐만 아니라
집에서 놀고 있는 PC, 랩탑 무엇이든 켜놓고
클로드를 설치하시어 클로드 코드에 가셔서
이 프롬프트를 입력하시면 됩니다.

제미나이도 됩니다.
마찬가지로 제미나이 데스크탑 설치하시고
‘작업’ 화면에서 하시면 됩니다.

각종 토큰 등 준비할 게 있을 텐데,
‘그거 어떻게 얻는 건데?’
‘그거 네가 그냥 넣어주면 안 돼?’
뻔뻔하게 물어보면 다 해줍니다.

힘든 장인데,
이런 거라도 하면서 재미를 찾아보시지요 ㅎㅎ

관심 종목 실적 발표 내용 트래커도 만들었습니다.
이것도 반응이 좋으면 프롬프트를 공개하겠습니다.

2026년 10월 네이버 블로그에 먼저 올린 글입니다. 원문 보기

클로드 코드로 리타민 구독 해지, 월 9만원 굳었다

주식 투자를 시작하고
비싸지만 꾸준히 구독해온 리타민.

모르시는 분이 있으시다면,
우리나라 증권사 리포트를
쉽게 조회할 수 있게 해주는 서비스다.

월 9만원이 사실 아깝지는 않지만
적지 않은 금액이었는데, 아끼게 됐다.

블로거 주삽이님께서
ChatGPT로 리포트를 전달해 주시는 것을 보면서
유레카 모멘트.

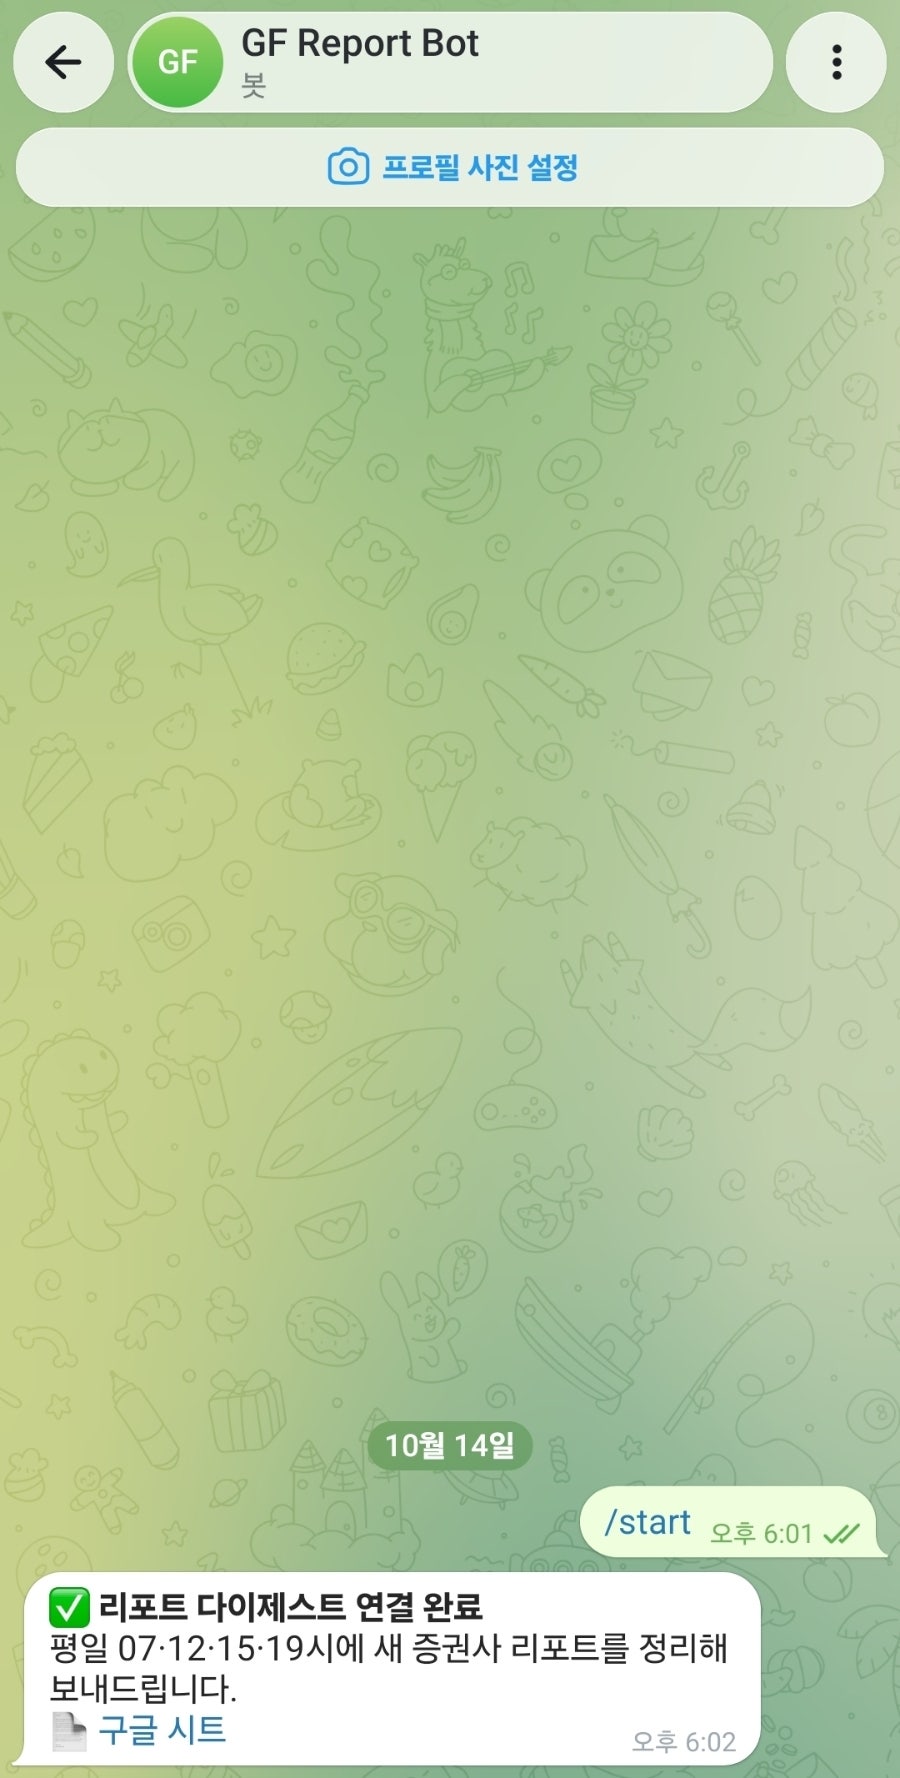
매일 아침 7시, 12시, 15시, 19시에
새로 발간된 리포트들을
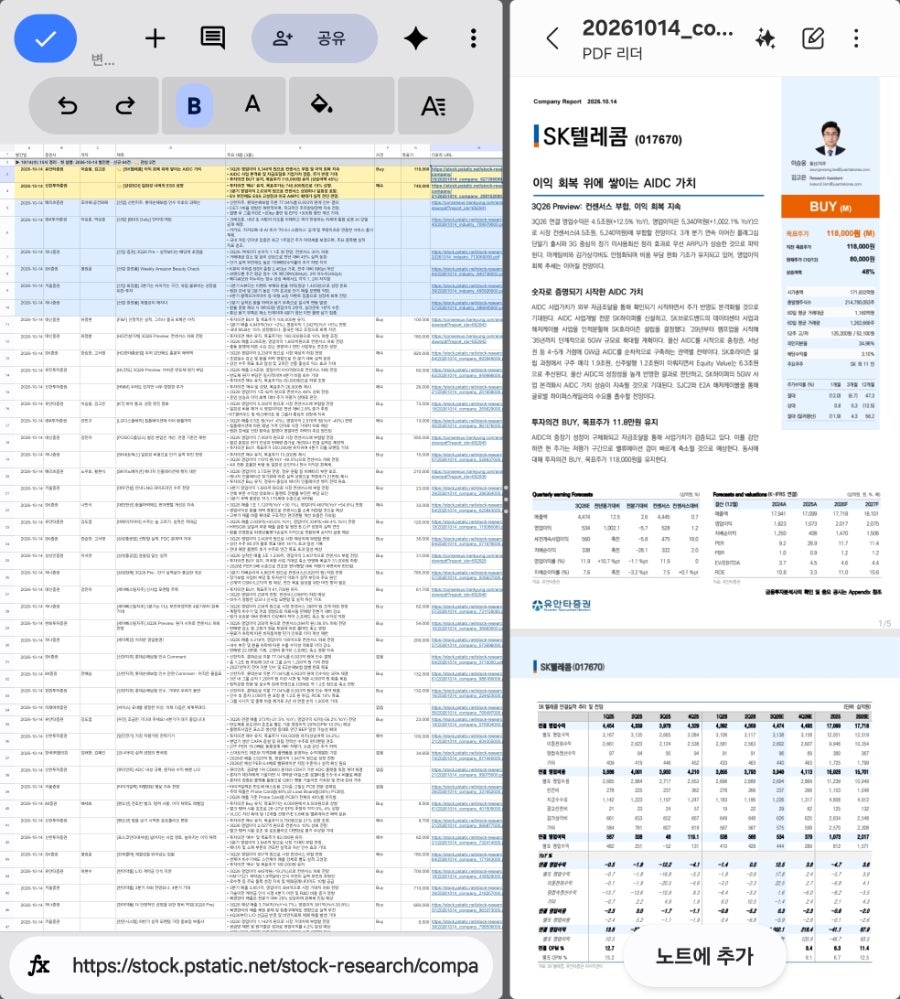
구글 스프레드시트에 정리해 주고,
텔레그램으로 알람을 준다.

스프레드시트에서 url로 본 리포트 보기도 가능한 것은 물론이다.

지난 설에 맥 미니를 구매한 이후
여러 일을 시켰지만
이렇게 실질적으로 돈을 아끼게 된 것은 처음 ㅎㅎ

그동안 고마웠어요 리타민 ㅠ

2026년 10월 네이버 블로그에 먼저 올린 글입니다. 원문 보기

삼성SDI, 아직 사지 않은 이유와 매수 계획 (56.7만원)

삼성SDI 3부작: 1편 · 2편 · 3편
🇺🇸 Read in English

삼성SDI에 대한 마지막 글.
1편에서는 이익의 질,
2편에서는 턴어라운드 단계와 성장률을 봤다.
이번에는 가격이다.

결론부터 쓰면,
자는 지금 가격(56.7만원, 분석시점인 10/9 종가 기준)에서는
새로 사지 않기로 했다.
눌림이 오면 53만~55만원에서 나눠 살 생각이다.

그리고 3Q26 실적을 확인한 뒤
종가가 59.7만원을 넘으면 더 산다.
아래는 그 이유.

1. 목표주가는 40만원부터 100만원까지

FnGuide 기준 19개 증권사 목표주가는 40.2만~100만원이다.
평균은 74.1만원이다.
현재가 56.7만원보다 31% 높다. (74.1 / 56.7 = 1.31)

재밌는 건 같은 이익 전망인데도 배수만 바꾸면 결과가 확 달라진다는 점이다.
배터리 셀 업종 배수(EV/EBITDA 8.2배) → 59만원 (iM, 7월)
전력기기 업종 배수(12.1배) → 80만원 (iM, 9월)
별도 적용 배수(15.5배) → 94만원 (DS, 10월)
결국 시장이 삼성SDI를 ‘배터리 회사’로 보느냐,
‘전력 인프라 회사’로 보느냐 같다.

2편에서 본 성장률도 같은 맥락이다.
높은 성장률을 보느냐, 꺾이는 델타값을 보느냐는 관점의 문제였다.
셀 업종 배수 기준 59만원은 현재가와 거의 같다. (59 / 56.7 = +4%)
배터리 회사로서의 가치는 이미 가격에 들어와 있다는 뜻아닐까.

참고로 LG엔솔과 비교하면 재무와 PBR은 삼성SDI가 낫고, 미국 ESS 생산능력은 작다.

부채/자본: 삼성SDI 77% vs LG엔솔 157%
PBR: 삼성SDI 1.9배 vs LG엔솔 4.2배
미국 ESS 생산능력: 삼성SDI 30GWh vs LG엔솔 50GWh 이상

재무 쪽에서 하나 더 있다.
잉여현금흐름(FCF)은 10개 분기 연속 적자다.
누적 약 9.9조원, 2Q26 순차입금은 10.6조원이다.
다만 삼성디스플레이 잔여 지분 10.22%가 남아 있다.
매각가 기준 약 9.1조원이다.
증자 없이 쓸 수 있는 카드가 남아 있다는 점은 경쟁사보다 낫다.
SK온은 증자를 반복했다.
대신 지분법이익이 약 33% 줄어, 2027년부터는 본업 이익이 더 중요해진다.

2. 차트: 상승 추세 속 수축

1년간 207,000원에서 567,000원으로 174% 올랐다.
(567 / 207 = 2.74배)
365일 추세선은 연 +120%로 여전히 상승 중이다.

눈에 띄는 건 볼린저밴드 폭이다.
14.1%로 1년 중 하위 10%다.
수축 뒤에는 한 방향으로 크게 움직이는 경우가 많다.
위든 아래든.

다만 걸리는 점도 있다.
상승 중인데 거래량이 줄었다.
20일 평균 거래량이 60일 평균의 0.83배다.
OBV(거래량 누적 지표)도 가격과 엇갈린다.

지금 가격은 지지 1(55.5만~56.8만원) 위,
저항 1(57.8만~59.7만원) 바로 아래다.
57.8만~59.7만원은 1년간 거래가 적었던 얇은 구간이다.

8월 31일 고점도, 10월 8일 장중 고점(59.1만원)도 여기서 밀렸다.
뚫으면 60만원 초반까지 빠르게 갈 수 있다.

하지만 그 위 60만~72만원에는 4~6월 고점에서 물린 매물이 기다린다.
지금 사면 어떻게 되는지 현재가 56.7만원 기준으로 계산해 봤다.

손절선 45.7만원까지는 -19%다.
1차 목표 60만~63.8만원까지는 +6~13%다.
손익비는 1:0.5다.
쫄보인 내겐 손이 나가지 않는 자리이다.

3. 수급: 이 종목은 기관이 끌고 간다

주가가 30% 넘게 오른 네 달은 모두 기관이 대량 순매수한 달이었다.
크게 빠진 6월(-29%)은 기관이 3,661억원을 팔았다.
1년 누적 순매수는 아래와 같다.
기관: +1.47조원
외국인: +1.09조원
개인: -2.45조원
개인은 또 일찍 내렸다..

추정 평균 매입단가는 기관 51.3만원, 외국인 53.4만원이다.
현재가는 기관 단가보다 +10.5%, 외국인 단가보다 +6.2% 위다.
(56.7/51.3, 56.7/53.4)

주가가 51만~53만원으로 내려오면 이들의 손익분기 근처다.
방어 매수가 나올 가능성이 있다.
1차 매수 구간을 53만~55만원으로 잡은 이유다.

4. 시나리오와 매매 계획

12개월 시나리오는 내 판단이다.
강세 25%: 80만원 (+41%)
– 3Q26 일회성 제외 흑자, 반제품의 매출 전환, 2027~28F 추정 상향.
기본 50%: 65만~70만원 (+15~23%)
– 분기 흑자 지속, EV 적자는 남음, 고점권 매물 소화.
약세 25%: 45만원 (-21%)
– 3Q26 일회성 제외 적자, ESS 가격 경쟁, 추정 하향.

확률 가중 기대가격을 계산하면 65만원이다.
(0.25×80 + 0.5×67.5 + 0.25×45, 기본은 중간값 적용)

현재가 대비 +15%다.
상승 여지는 있지만 약세 쪽 하락폭(-21%)도 크다.
한 번에 사기보다 조건을 확인하며 나눠 사는 게 맞다.

매매 계획
지금 56.7만원: 신규 매수 보류. 기존 보유자는 유지.
눌림 1차 53만~55만원: 30%
눌림 2차 49만~51만원: 30%
돌파 추가: 40%
손절: 종가 45.7만원 (돌파 매수분은 55.5만원)

돌파 추가의 조건은 세 가지가 동시에 맞을 때다.
1) 3Q26 실적 확인 후 종가 59.7만원 돌파.
2) 거래량이 평소의 1.5배.
3) 기관·외국인 동반 순매수.

눌림 없이 바로 돌파하면 40%만 담고 시작한다.
둘 다 안 오면?
기다린다.

앞으로 확인할 것

1) 10월 말 3Q26 실적: 보상금,AMPC 제외 이익, ESS 매출 30%대 증가, 반제품 재고 감소, 2027F 컨센서스 변화
2) 수급: 59.7만원 돌파 시 기관·외국인 동반 매수, 외국인 보유율 26.7% 돌파 여부
3) 11월: 한국은행 금리 결정, 미국 45X·48E 규정 변화
4) 4Q26: 인디애나 LFP 양산과 AMPC 증가, 뉴칼라일 ESS 전환, 북미 신규 수주

3Q26 실적이 나오면 이 글과 비교해서 복기해 보자.
(투자 권유가 아닌 개인 기록이며, 시나리오 확률과 가격은 나의 판단이다. 판단과 책임은 각자에게 있다.)

2026년 10월 네이버 블로그에 먼저 올린 글입니다. 원문 보기

삼성SDI 턴어라운드, SK하이닉스와 닮아있을까? (Feat. 재고와 이익 전망)

삼성SDI 3부작: 1편 · 2편 · 3편
🇺🇸 Read in English

어제1편 끝에서 SK하이닉스와 비교해 삼성SDI가 턴어라운드의 어디쯤와 있는지 보겠다고 썼다.

궁금한 것은 이거다.
‘올해 170%나 오른 삼성SDI의 주가는 더 오를 여지가 있을까?’

2022~2024년 SK하이닉스의 턴어라운드와 비교해보았다.
삼성SDI도 당시의 SK하이닉스와 마찬가지로
회복 초입에 서있다.
주가 바닥 → 최대 손실 → 흑자 전환의 순서다.

문제는 주가가 이익보다 먼저, 그리고 많이 간 느낌.

다만 투자는 절대평가가 아니라 상대평가다.
성장률로 보면 현재 다른 주도 섹터보다 매력적이다.
이부분은 나도 인정이다.
그래서 지난달에 2차전지섹터 비중을 확대했다.

다만 10월에 3Q26 실적이 나오면
그때 확인할 사항들을 확인하고 비중을 늘리는게 맞을 것 같다.

그 전에는 가격이 충분히 내려올 때만 나눠 산다.

확인할 사항은 네 가지다.
1) 반제품 재고가 줄었는가.
2) ESS 매출이 30%대 늘었는가.
3) 보상름과 AMPC를 뺀 이익이 흑자인가.
4) 2027F 이후 이익 추정이 함께 올라오는가.
네 가지가 모두 맞으면 주가가 이익을 따라잡은 것이다.

이렇게 보수적으로 보는 이유는 3가지다.
1) SK하닉과 같은 턴어라운드 단계에서 주가가 두 배 더 올랐다.
2) ‘다음 단계’ 신호(재고 감소, 선수금 증가)가 아직이다.
3) 성장률은 압도적이지만, 상향이 올해에 몰렸고 지속성(델타값)이 아쉽다.

하나씩 살펴보자.

1. 같은 턴어라운드 단계에서 주가가 두 배 더 올랐다

하닉의 주가 바닥은 최대 손실보다 1분기, 흑자 전환보다 4분기 앞섰다.

SK하이닉스: 2022.12 주가 바닥 → 1Q23 최대 손실 → 4Q23 흑자 전환

다음은 삼성SDI

삼성SDI: 2Q25 주가 바닥 → 3Q25 최대 손실 → 2Q26 흑자 전환

순서는 같다.
하지만 흑자 전환 분기까지
주가가 오른 폭이 다르다.

SK하이닉스: +89%
삼성SDI: +182%

같은 단계에서 주가가 두 배 더 올랐다.
182 / 89 = 2.04배

그 뒤를 받칠 이익 체력도 다르다.
SK하이닉스는 이후 영업이익률이 40%까지 올라 주가를 받쳤다.
삼성SDI의 2027년 추정 영업이익률은 8~9%다.
그마저도 대부분이 AMPC(미국 생산 세액공제)다.
시장이 이미 많이 앞서 갔다는 느낌이다.

2. ‘다음 단계’ 신호가 아직 없다

SK하이닉스는 재고가 회복을 먼저 알렸다.
제품 재고가 정점(2Q23) 이후 48% 줄었다.
삼성SDI는 반대다.

삼성SDI 재고 변화(2Q25 → 2Q26)
총재고: 2.58조원 → 3.68조원 (+43%)
반제품: 0.92조원 → 1.86조원 (+102%)
선수금: 1.09조원 → 0.61조원 (-44%)
재고는 쌓였고, 선수금은 줄었다.

2Q26 재고 3.68조원은 2Q24 정점과 같은 수준이다.
재고일수는 118일로 최근 10개 분기 중 가장 길다.
소형전지 가동률은 57%에서 81%로 올랐다.
수요가 돌아온 건 맞다.
하지만 선수금으로는 아직 안 보인다.

SK하이닉스의 ‘제품 재고 감소’가 삼성SDI에서는 아직 확인되지 않았다.
물론 반제품이 출하 대기 물량일 수 있다.
IBK에 따르면 2Q26 국내 전력용 ESS 매출이 3분기로 이연됐다.
3Q26에 반제품이 줄고 ESS 매출이 30%대 늘면 그 해석이 맞다.

3. 성장률은 압도적이지만, 지속성이 아쉽다

1~2번만 보면 2022년 SK하이닉스의 강한 턴어라운드보다 아쉬운 면이 있다.
하지만 투자는 절대평가가 아니다.
같은 시점에 다른 투자안보다 얼마나 매력적인지가 중요하다.

지금 시장이 삼성SDI와 2차전지 섹터에서 보는 건
올해와 내년의 성장률이다.
그래서 성장률을 점검했다.

비교 대상은 또 다른 주도 섹터인 반도체 소부장(HPSP, 피에스케이홀딩스)이다.
수치는 FnGuide 영업이익 컨센서스(2026.10.08 기준)의 전년 대비 증가율이다.
먼저 장점이다.

2027F 영업이익 성장률
삼성SDI: +235%
HPSP: +54.6%
피에스케이홀딩스: +50.5%
삼성SDI의 27F 성장률은 소부장의 4배가 넘는다.
(235 / 54.6 = 4.3배, 235 / 50.5 = 4.7배)

2028F 영업이익 성장률
삼성SDI: +74.3%
HPSP: +22.3%
피에스케이홀딩스: +14.4%
2028F에도 3배 이상이다.
(74.3 / 22.3 = 3.3배, 74.3 / 14.4 = 5.2배)

이게 시장이 삼성SDI의 성장률에 관심을 갖는 이유아닐까.
문제는 지속성이다.
첫째, 이익 전망 상향이 올해에 몰려 있다.

영업이익 컨센서스, 최근 3개월 변화
2026F: 3,063억원 → 4,463억원 (+46%)
2027F: 1조 3,977억원 → 1조 4,950억원 (+7.0%)
2028F: 2조 4,303억원 → 2조 6,054억원 (+7.2%)
2026F 상향폭은 1,400억원이다.
3Q26 GM JV 보상금(약 1,500억원)과 거의 같은 규모다.
미래 이익 전망이 올라갔다기보다 올해 일회성이 반영된 것에 가깝다고 본다.

둘째, 성장률의 가속도가 꺾인다.
성장률이 전년보다 더 빨라졌는지를 보는 지표를 델타값이라고 부른다.
속도가 빠른 것과 속도가 더 빨라지는 것은 다르다.

델타값(2028F 성장률 – 2027F 성장률)
삼성SDI: -160.7%p
HPSP: -32.2%p
피에스케이홀딩스: -36.1%p
삼성SDI의 둔화 폭이 소부장의 4~5배다.
(160.7 / 36.1 = 4.5배, 160.7 / 32.2 = 5.0배)

2027F는 +235%로 여전히 높은 성장이다.
하지만 2028F로 가면 델타값이 마이너스로 꺾인다.

델타값이 늘어날 때 시장은 열광하는 경향이 있다고 본다.
지금 컨센서스는 그렇게 보고 있지 않다.

물론 기저효과가 크다.
2025년 적자에서 나오는 성장률이라 높을 수밖에 없고,
꺾이는 폭도 클 수밖에 없다.

참고로 금액으로 보면 증가폭은 비슷하다.
2027F 증가폭: +1조 487억원 (14,950 – 4,463)
2028F 증가폭: +1조 1,104억원 (26,054 – 14,950)

그래서 성장률은 장점이자 단점이다.
레벨은 소부장보다 훨씬 높고, 지속성은 아쉽다.
어디에 무게를 두느냐가 관점 포인트다.

나는 시장이 다시 열광하려면 델타값이 개선돼야 한다고 본다.
그러려면 2027F 이후 이익 추정이 더 올라와야 한다.

10월 말 3Q26 실적에서 위에 적은 네 가지 기준을 확인한다.
1) 반제품 재고가 줄었는가.
2) ESS 매출이 30%대 늘었는가.
3) 보상름과 AMPC를 뺀 이익이 흑자인가.
4) 2027F 이후 이익 추정이 함께 올라오는가.

확인되면 비중을 늘리는 게 맞다는 생각이다.

성장률이 매력적이라면 남는 질문은 가격이다.
이 성장에 얼마를 낼 것인가.

마지막 편에서 밸류에이션과 매매 계획을 정리한다.

2026년 10월 네이버 블로그에 먼저 올린 글입니다. 원문 보기

삼성SDI 흑자 전환, 그런데 이익의 질은? (Feat. 2Q26 실적과 3Q26 전망)

삼성SDI 3부작: 1편 · 2편 · 3편
🇺🇸 Read in English

삼성SDI가 2Q26에 영업이익 2,038억원을 내면서
7개 분기 만에 흑자로 돌아섰다.
주가는 1년 사이 174% 올랐다.

ESS는 포지션이 없어도 늘 들여다보던 섹터였다.

작년 8월에 미국 BESS 시장에서 한국 배터리사의 기회를 정리하면서
LG엔솔보다 삼성SDI를 지켜보자고 썼었다.
OBBBA의 PFE 조항 때문에 중국산 퇴출은 확정적이라고 봤고,
ESS 사업이 전사 실적에 유의미하게 기여할 수 있는 쪽은
시가총액 15.5조원짜리 삼성SDI라고 계산했기 때문이다.

다만 그때는 손익비가 안 맞았다.
다운사이드 -36%에 업사이드가 1:1도 안 나와서
‘삼성의 수주 현황과 증가 속도를 보면서 업데이트할 아이디어’로 미뤄뒀다.

올해 1월에는 ERCOT, PJM, SPP가 데이터센터 전력 공급 중단 조치를 꺼내는 걸 보면서
데이터센터에 BESS 설치가 필수가 되지 않겠냐고 적었고,
7월에는 호주 사례를 보면서
전력망 부담에 ESS만큼 손쉬운 해답이 없다고 썼다.
그런데 그때까지도 2차전지와 ESS 관련 포지션은 전혀 없었다.

아래는 그간의 ESS 관련 기록.

그 사이 숫자가 달라졌다.
그때 15.5조원이던 삼성SDI 시가총액은
지금(10월 8일 종가 567,000원) 45.7조원이다.

그리고 최근 이차전지 섹터의 추세가 심상치 않다.
업황이 아니라 수급과 프레임이 먼저 움직이는 모습이다.
‘배터리 회사’로 묶여 있던 종목들이
AI 전력 인프라 쪽으로 다시 분류되는 중이라고 해야 할까.
지켜보자고만 쓰고 넘어갈 자리는 아닌 것 같아서,
일단 매수를 했다.

그리고 삼성SDI를 다시 처음부터 뜯어봤다.
DART 공시, 증권사 리포트, 수급 데이터까지 모아서 보고서로 정리했고,
분량이 많아서 3편으로 나눠 올린다.

1편은 산업과 실적, 즉 ‘이익의 질’
2편은 턴어라운드 단계와 이익 전망의 델타값
3편은 밸류에이션, 기술적 분석, 그리고 매매 계획이다.

이번에도 틀리기 위한 기록.

1. 산업: 성장의 중심이 EV에서 ESS로

2026년 글로벌 ESS 설치는 459GWh로 50% 늘지만,
EV 배터리 수요는 1.5TWh로 13% 증가에 그친다.
배터리 전체 수요 중 ESS 비중은 19%에서 23%로 커진다.

EV는 지역별로 갈린다.
유럽 +20%, 중국 +5%, 미국은 -10%다.

미국은 AI 데이터센터와 전력망 부족이 ESS 수요를 만든다.
데이터센터 IT 부하는 2026년 43GW에서 2030년 91GW로 늘 전망이다.
가스터빈 리드타임이 4년인 상황에서
가장 빨리 깔 수 있는 해답이 ESS라는 건 호주 사례에서도 봤다.

핵심은 미국 세액공제(48E)다.
비중국 공급망 비중을 2026년 55%에서 2030년 75%까지 요구한다.
세액공제를 반영한 투자비는
중국산 셀 $241.5/kWh vs. 한국 업체 미국 생산 $135.1/kWh로 추정된다.

작년에 PFE 조항 때문에 중국산 퇴출은 확정적이라고 썼는데,
그 방향은 맞아 가는 것 같다.
미국 ESS에서 중국 셀 점유율이 1H26 71.2%에서 2028년 3.9%로 줄 거라는 전망까지 나온다.

삼성SDI는 올해 미국 ESS 공급 계약 2건을 확보했다.
테슬라향 약 3조원(보도), 미국 에너지 기업 약 1.5조원.
모두 인디애나 스타플러스 공장 생산분이다.

다만 EV 쪽이 문제다.
최대 고객 BMW의 신규 플랫폼이 CATL 중심으로 바뀌면서
EV 물량이 3년째 줄었다.

2. 실적: 흑자 전환, 하지만

2025년 3분기 -5,913억원이 바닥이었고,
2Q26에 2,038억원으로 흑자 전환했다.
매출총이익률은 5.5%에서 24.9%로 올라 2024년 수준을 넘었다.

숫자만 보면 깔끔한 턴어라운드다.
하지만 뜯어보면 이야기가 조금 다르다.

2Q26 영업이익 2,038억원 = 관세 환급 약 1,900억원 + AMPC 1,077억원 + 나머지 약 -940억원

관세 환급과 AMPC를 빼면 아직 적자다.
게다가 상반기 세전이익(4,358억원)보다
지분법이익(5,164억원)이 더 크다.
이익의 대부분이 삼성디스플레이 지분에서 나왔다는 뜻이다.

그렇다면 3분기는?

DS투자증권은 3Q26 영업이익을 2,575억원, 대신증권은 2,590억원으로 본다.
컨센서스(1,318억~1,415억원)의 약 두 배다.

그런데 여기에도 GM JV 보상금 약 1,500억원과 AMPC 1,035억원이 들어 있다.
둘을 빼면 약 40억원.
손익분기 수준이다.

물론 의미가 없는 건 아니다.
관세 환급이 사라진 첫 분기에
일회성을 빼고도 적자가 아니라는 점은 2Q26과 다르다.
ESS 매출은 국내 이연 물량으로 +35% QoQ, 소형전지는 흑자 전환이 예상된다.
4Q26에는 인디애나 LFP 라인 양산으로 ESS 매출이 50~60% 늘 전망이다.

3. 2027년 이익의 대부분은 AMPC

가장 고민되는 부분은 이거다.

하나증권 추정으로 2027년 영업이익 1.48조원 중 AMPC가 1.40조원(94%),
DS투자증권은 1.8조원 중 1.16조원(64%)이다.
증권사마다 다르지만 어쨌든 절반 이상이 세액공제다.
EV 부문은 2028년까지 적자가 이어진다.

AMPC 단가는 2030년부터 줄어 2033년 소멸한다.
즉, 미국 정책이 바뀌거나 미국 라인 가동이 늦어지면
2027~2028년 이익 전망이 통째로 흔들릴 수 있다.

반대로 반가운 부분도 있다.
데이터센터용 BBU(셀 점유율 약 50%)와 UPS는 AMPC 없이도 이익을 낸다.
2Q26 관련 매출이 전년 대비 70% 이상 늘었다.
개인적으로는 이 사업이 삼성SDI를 ‘배터리 회사’가 아니라
‘AI 전력 인프라 회사’로 보는 시나리오도 언젠가 나올수도 있겠다 싶다.

1편 정리
1) 산업 방향(EV→ESS, 탈중국)은 삼성SDI에 유리하다.
2) 흑자 전환은 맞지만, 2Q26·3Q26 모두 일회성과 AMPC를 빼면 손익분기 이하다.
3) 2027년 이익도 AMPC 의존도가 높다. 정책 리스크를 안고 가는 구조다.

결국 10월 말 3Q26 실적에서
보상금과 AMPC를 뺀 이익이 얼마인지 봐야 한다.

다음 편에서는 SK하이닉스의 2022~2024년과 비교해
삼성SDI가 턴어라운드의 어디쯤에 있는지 보려고 한다.

(투자 권유가 아닌 개인 기록이며, 판단과 책임은 각자에게 있다.)

2026년 10월 네이버 블로그에 먼저 올린 글입니다. 원문 보기