Samsung SDI series: Part 1 · Part 2 · Part 3
🇰🇷 한국어 원문 · Originally written in Korean on Oct 13, 2026. Charts are in Korean; key figures are restated in the text.
Summary
- Samsung SDI is following the same sequence as SK Hynix in 2022-2024: share price bottom, peak losses, then a return to profit.
- The difference: SDI’s stock rose 182% by the breakeven quarter vs. 89% for SK Hynix. Twice the move, with a 2027E operating margin of only 8-9%, mostly AMPC.
- The “next stage” signals haven’t shown up yet. Work-in-process inventory doubled YoY and customer advances fell 44%.
- Growth is the bull case: 2027E operating profit growth of +235% is over 4x that of Korean semi equipment leaders. But the delta (acceleration) turns sharply negative in 2028E.
- I’ll add only on meaningful dips until 3Q26 results confirm four specific checkpoints.
At the end of Part 1, I said I’d compare Samsung SDI with SK Hynix to see how far along SDI is in its turnaround.
The question I’m trying to answer: after a ~170% run this year, does SDI’s stock still have room to go?
I benchmarked it against SK Hynix’s 2022-2024 turnaround. Like SK Hynix back then, SDI is in the early innings of a recovery, following the same sequence: share price bottom, then peak losses, then a return to profit.
My concern is that the stock has run ahead of earnings, and by a lot.
That said, investing is relative, not absolute. On growth, SDI looks more attractive right now than the other market-leading sectors, and I’ll concede that point. It’s why I raised my weighting in Korean battery names last month.
Still, I think the right move is to wait for 3Q26 results in late October, check a few things, and only then size up. Before that, I’ll only buy in tranches if the price comes down enough.
Four things I want to see:
- Has work-in-process (WIP) inventory come down?
- Has ESS revenue grown by 30%+?
- Is the business profitable ex-compensation and ex-AMPC?
- Are 2027E+ earnings estimates moving up alongside?
If all four check out, earnings will have caught up with the share price.
Three reasons I’m staying conservative:
- At the same turnaround stage, SDI’s stock has risen twice as much as SK Hynix’s did.
- “Next stage” signals (inventory drawdown, rising customer advances) haven’t appeared yet.
- Growth is outstanding, but upgrades are concentrated in this year and the durability (delta) is lacking.
Let’s go one by one.
1. Same Turnaround Stage, Twice The Share Price Move
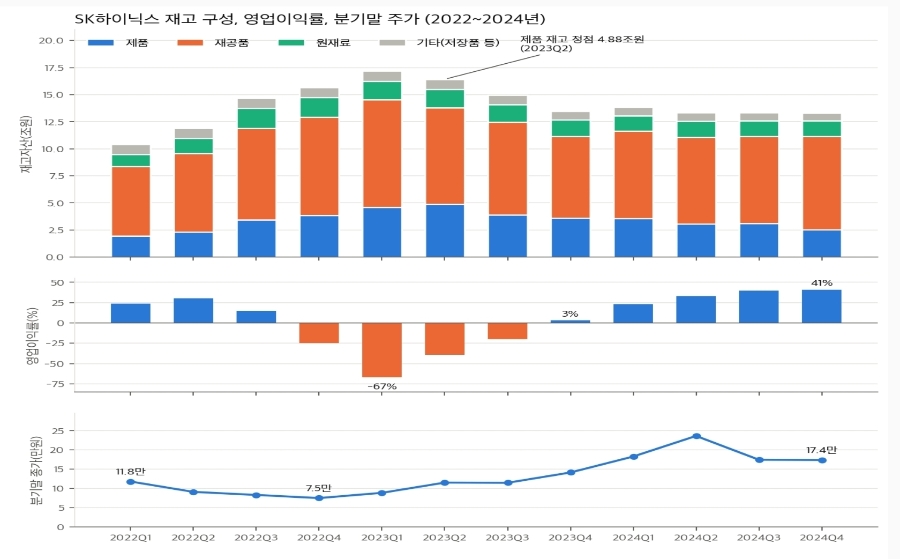
SK Hynix’s share price bottomed one quarter before peak losses and four quarters before returning to profit.
SK Hynix: share price bottom Dec 2022 → peak loss 1Q23 → back to profit 4Q23
Now Samsung SDI:
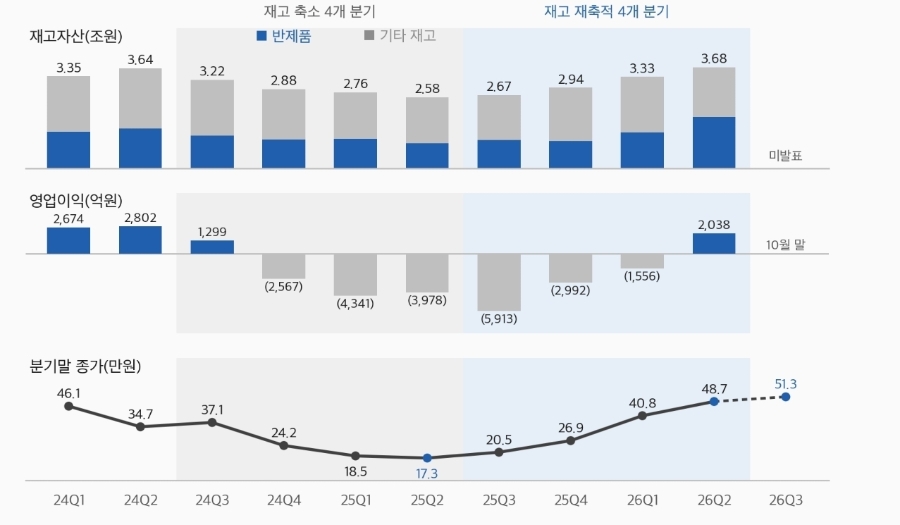
Samsung SDI: share price bottom 2Q25 → peak loss 3Q25 → back to profit 2Q26
Same sequence. But the share price gain up to the breakeven quarter is very different:
- SK Hynix: +89%
- Samsung SDI: +182%
At the same stage, SDI has run about twice as far (182 / 89 = 2.04x).
The earnings power to back it up is different too. SK Hynix went on to operating margins of 40%, which supported the stock. SDI’s 2027E operating margin is 8-9%, and most of that is AMPC (the US advanced manufacturing production credit). It feels like the market has already gotten well ahead of itself.
2. No “Next Stage” Signal Yet
At SK Hynix, inventory flagged the recovery first. Finished goods inventory fell 48% from its 2Q23 peak. SDI is going the other way.
Samsung SDI inventory, 2Q25 → 2Q26:
- Total inventory: ₩2.58tn → ₩3.68tn (+43%)
- Work-in-process: ₩0.92tn → ₩1.86tn (+102%)
- Customer advances: ₩1.09tn → ₩0.61tn (-44%)
Inventory has built up while advances have fallen.
2Q26 inventory of ₩3.68tn matches the 2Q24 peak. Days of inventory are at 118, the longest in the last ten quarters. Small-cell utilization has risen from 57% to 81%, so demand is clearly back. But it isn’t showing up in customer advances yet.
The finished-goods drawdown that marked SK Hynix’s turn hasn’t been confirmed at SDI. To be fair, the WIP could simply be product waiting to ship. According to IBK Securities, some domestic grid ESS revenue slipped from 2Q26 into 3Q26. If WIP falls and ESS revenue grows 30%+ in 3Q26, that reading will be vindicated.
3. Growth Is Outstanding, Durability Less So
On points 1 and 2 alone, SDI looks weaker than SK Hynix’s powerful 2022 turnaround. But again, investing isn’t graded on an absolute scale. What matters is how attractive it is relative to other opportunities at the same moment.
What the market is looking at in SDI and Korean batteries right now is growth over this year and next. So I checked the growth numbers.
My comparison group is the other leading theme in Korea: semiconductor equipment and materials, represented by HPSP and PSK Holdings. Figures are YoY growth in FnGuide operating profit consensus (as of Oct 8, 2026). First, the good news:
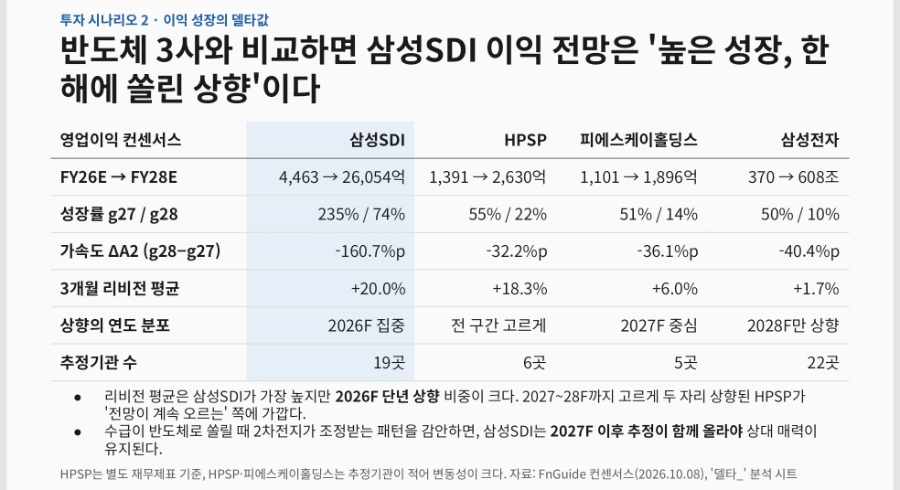
2027E operating profit growth
- Samsung SDI: +235%
- HPSP: +54.6%
- PSK Holdings: +50.5%
SDI’s 2027E growth is more than 4x the equipment names (235 / 54.6 = 4.3x; 235 / 50.5 = 4.7x).
2028E operating profit growth
- Samsung SDI: +74.3%
- HPSP: +22.3%
- PSK Holdings: +14.4%
Still more than 3x in 2028E (74.3 / 22.3 = 3.3x; 74.3 / 14.4 = 5.2x).
That’s probably why the market is so focused on SDI’s growth. The problem is durability.
First, the estimate upgrades are concentrated in this year.
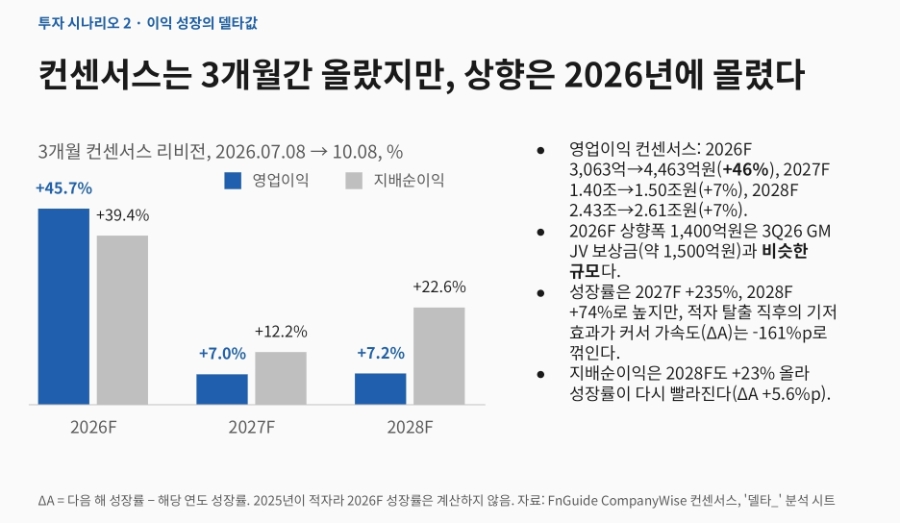
Operating profit consensus, 3-month change
- 2026E: ₩306.3bn → ₩446.3bn (+46%)
- 2027E: ₩1.398tn → ₩1.495tn (+7.0%)
- 2028E: ₩2.430tn → ₩2.605tn (+7.2%)
The 2026E upgrade is ₩140bn, almost exactly the size of the ~₩150bn GM JV compensation expected in 3Q26. To me, this looks less like a higher long-term earnings outlook and more like a one-off being baked into this year.
Second, growth is decelerating. I call the change in growth rate versus the prior year the “delta.” Going fast and accelerating are two different things.
Delta (2028E growth minus 2027E growth)
- Samsung SDI: -160.7pp
- HPSP: -32.2pp
- PSK Holdings: -36.1pp
SDI’s deceleration is 4-5x that of the equipment names (160.7 / 36.1 = 4.5x; 160.7 / 32.2 = 5.0x).
+235% in 2027E is still huge growth. But by 2028E, the delta turns sharply negative.
In my experience, the market tends to get excited when the delta is expanding. Current consensus doesn’t see that happening.
Base effects matter, of course. Growth off a 2025 loss is bound to be high, and the slowdown is bound to look steep. In absolute terms, the increments are similar:
- 2027E increase: +₩1.049tn (14,950 – 4,463, in ₩100m)
- 2028E increase: +₩1.110tn (26,054 – 14,950)
So growth is both a strength and a weakness. The level is far above the equipment names; the durability is underwhelming. Which one you weight more heavily is the crux of the debate.
My view is that for the market to get excited again, the delta needs to improve, which means 2027E+ estimates need to move higher.
In the late-October 3Q26 results, I’ll be checking the four criteria above:
- Has WIP inventory come down?
- Has ESS revenue grown by 30%+?
- Is the business profitable ex-compensation and ex-AMPC?
- Are 2027E+ earnings estimates moving up alongside?
If they’re confirmed, I think adding to the position is the right call.
If the growth is attractive, the remaining question is price. How much should you pay for this growth?
In the final part, I lay out valuation and my trading plan.
Disclosure: I have a long position in Samsung SDI (006400.KS). This is a personal investment journal, not investment advice. Scenario probabilities and price levels are my own judgment. Do your own due diligence.


댓글 3개